In my Data Visualization Class, I tracked ten days of gratitude and kindness. Choosing two forms applied to myself and others, I analyzed this qualitative data by finding quantitative trends and common descriptors.
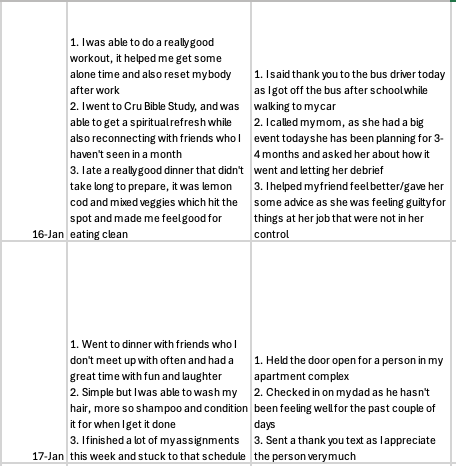
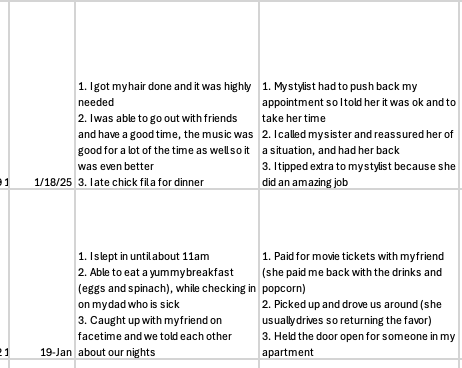
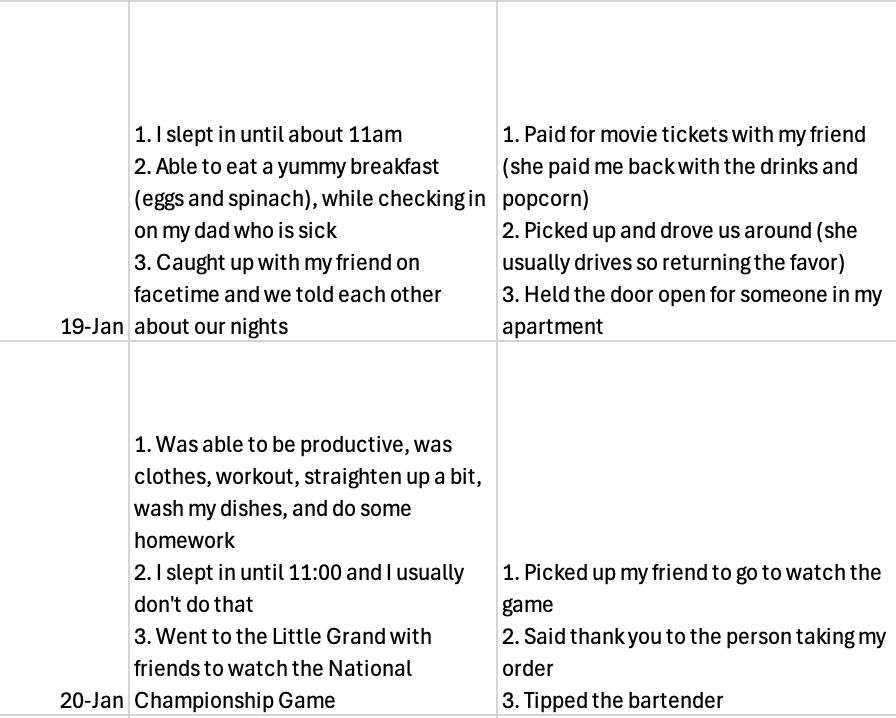
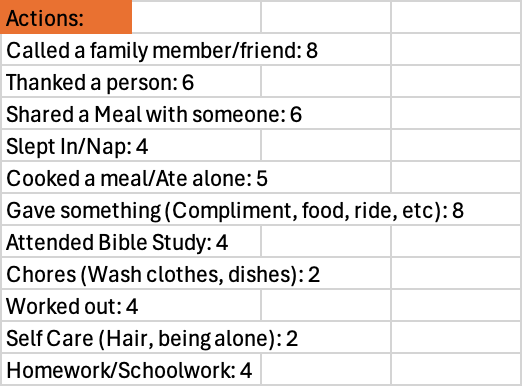
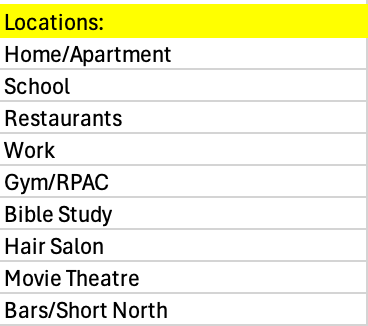
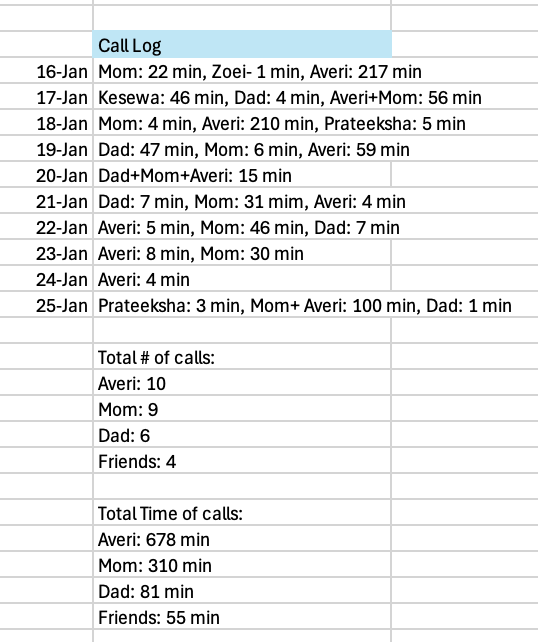
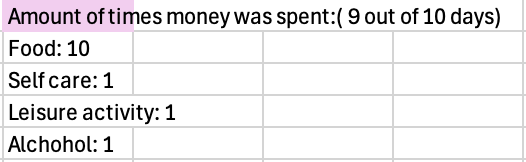
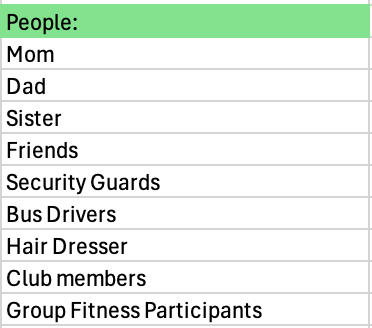
Raw data from my survey of 3 areas of kindness to others and gratitude to myself through google forms and the analysis through excel.
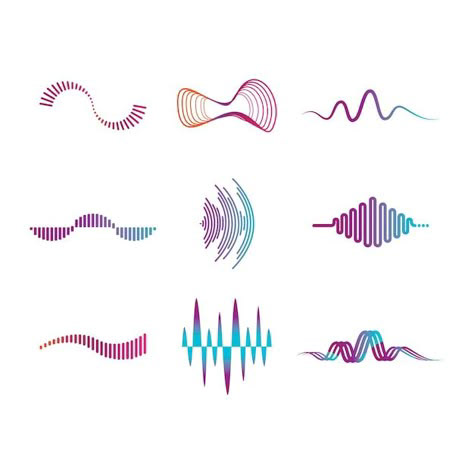
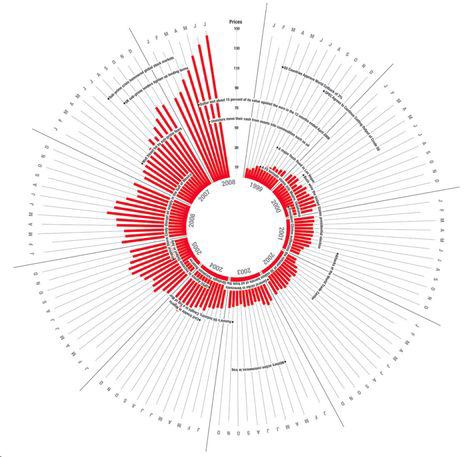
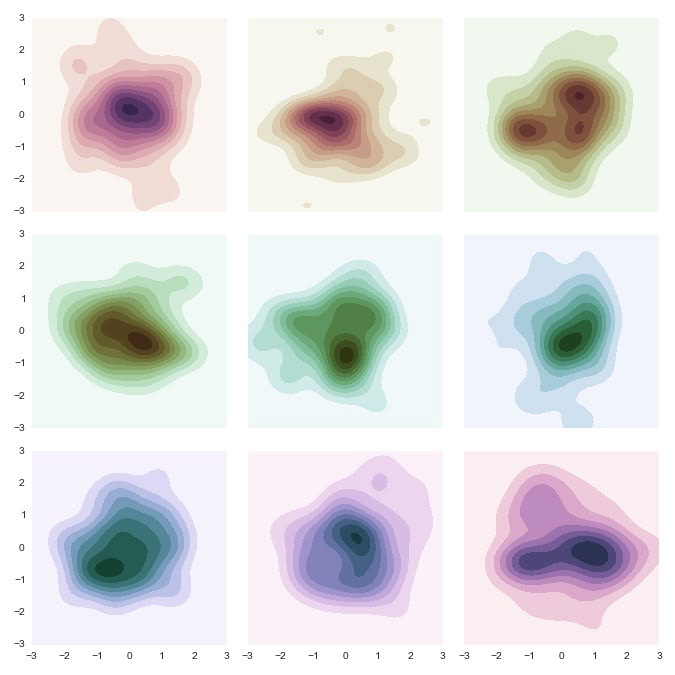
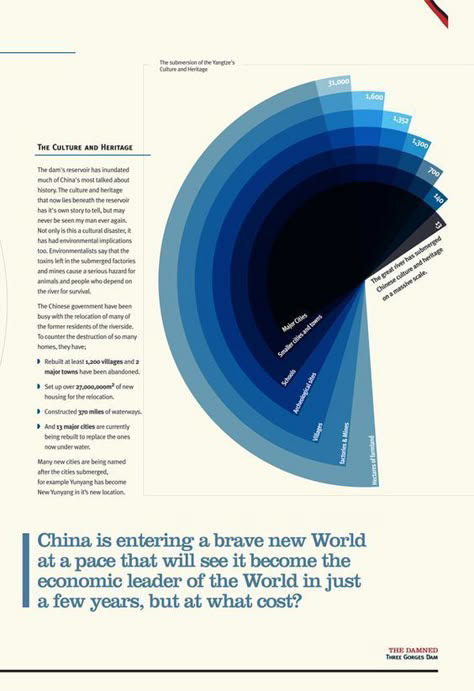
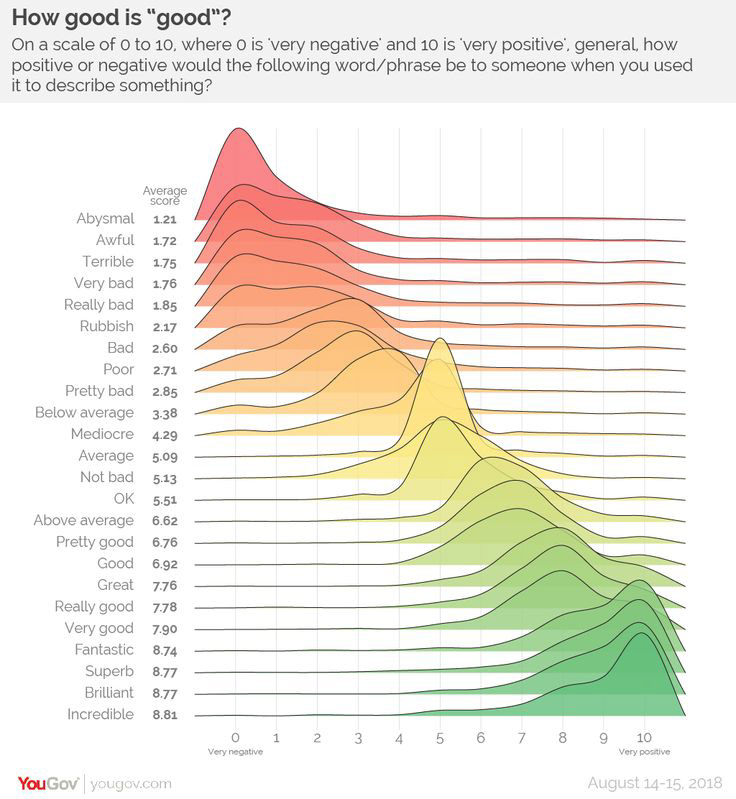
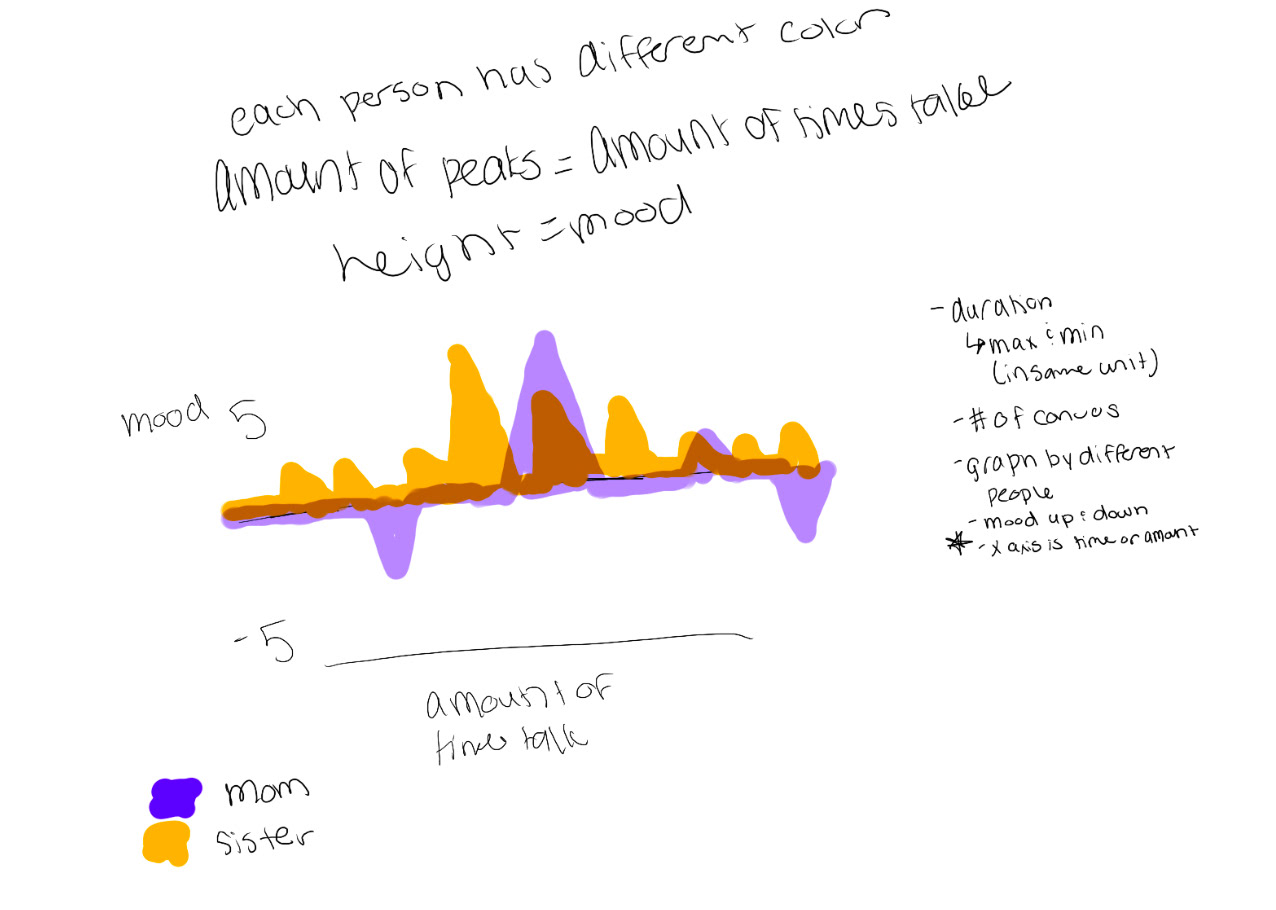
Inspiration for how to potentially visualize my data.
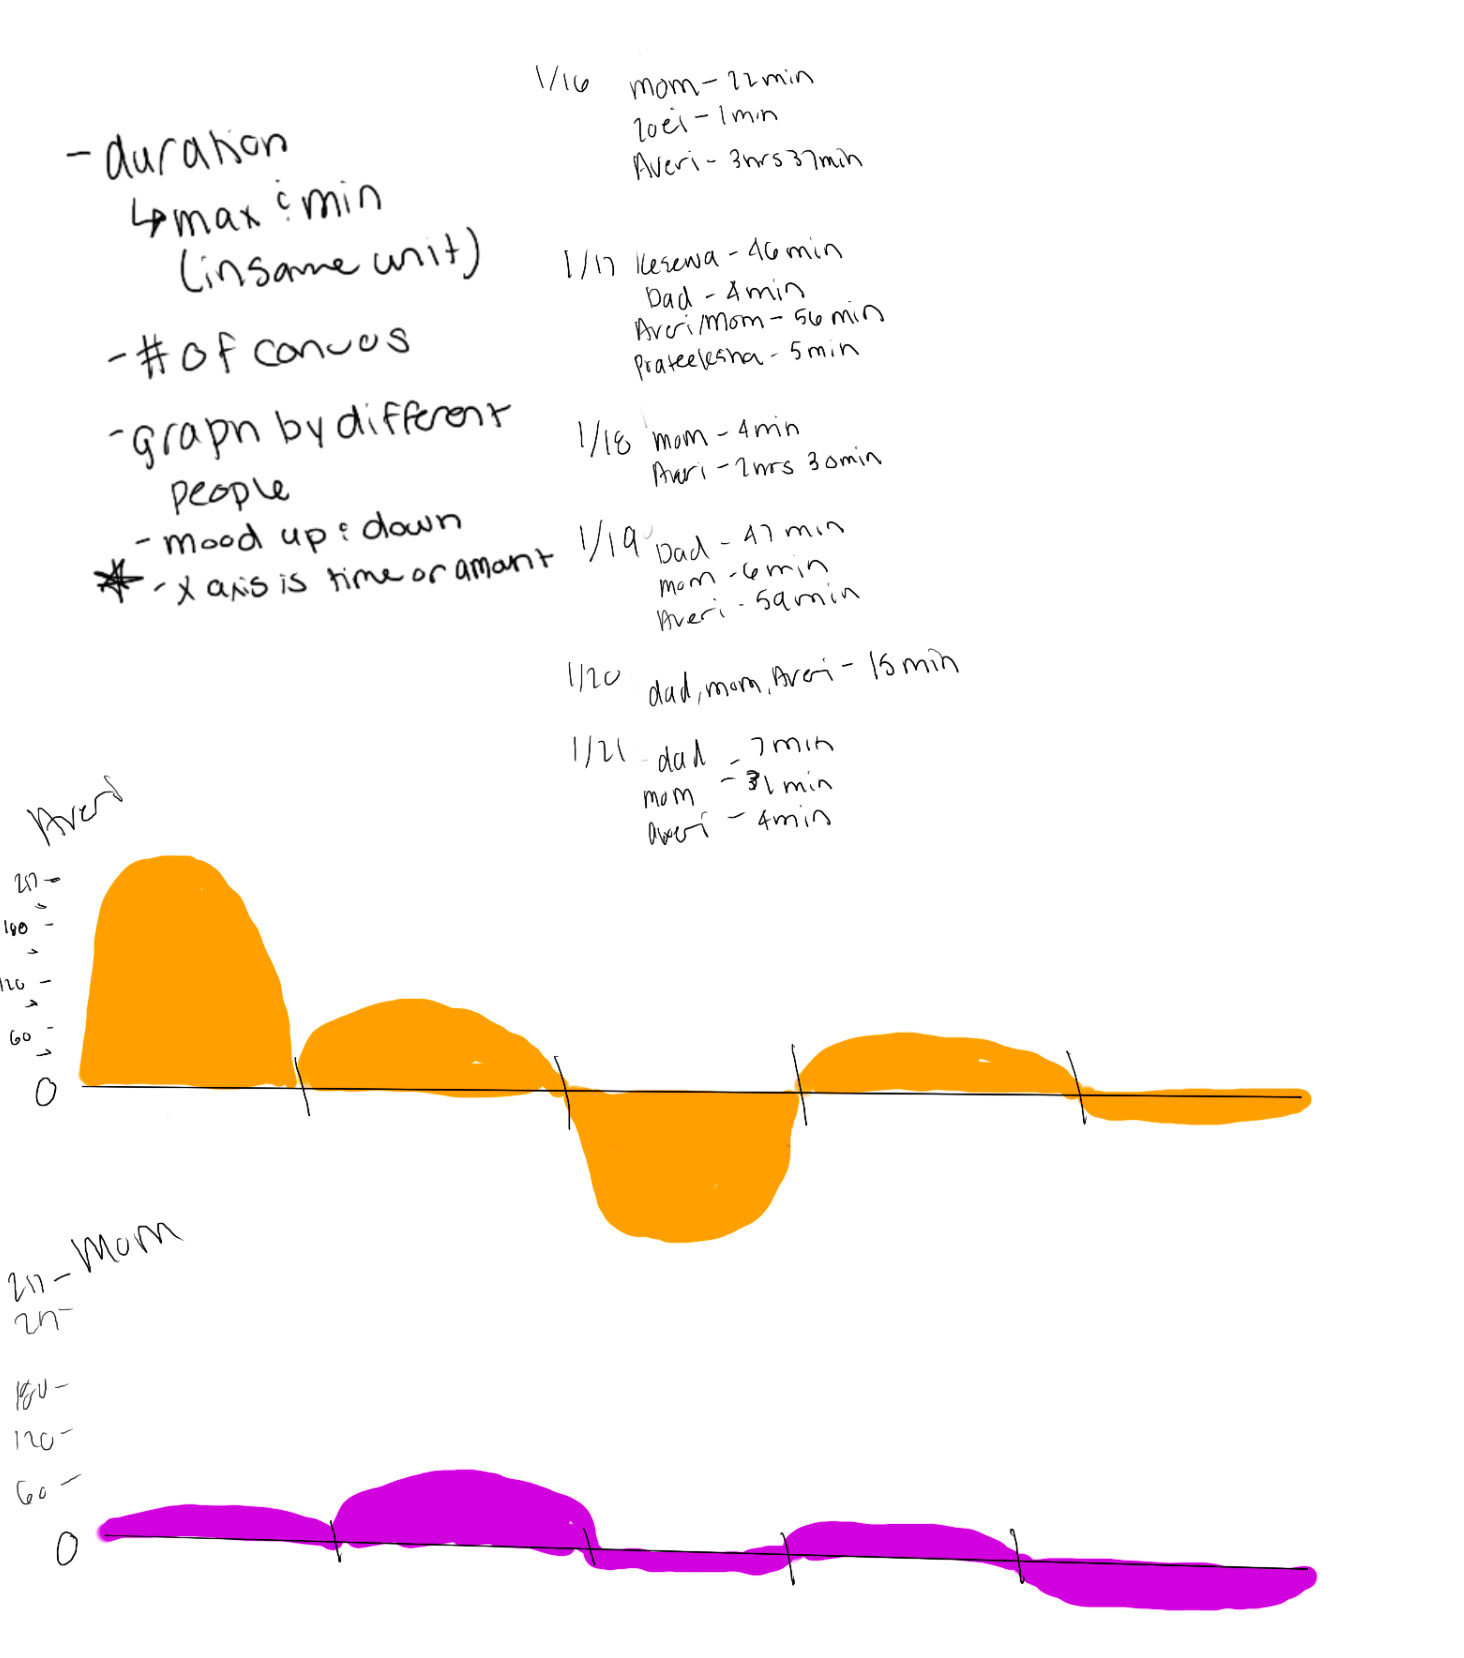
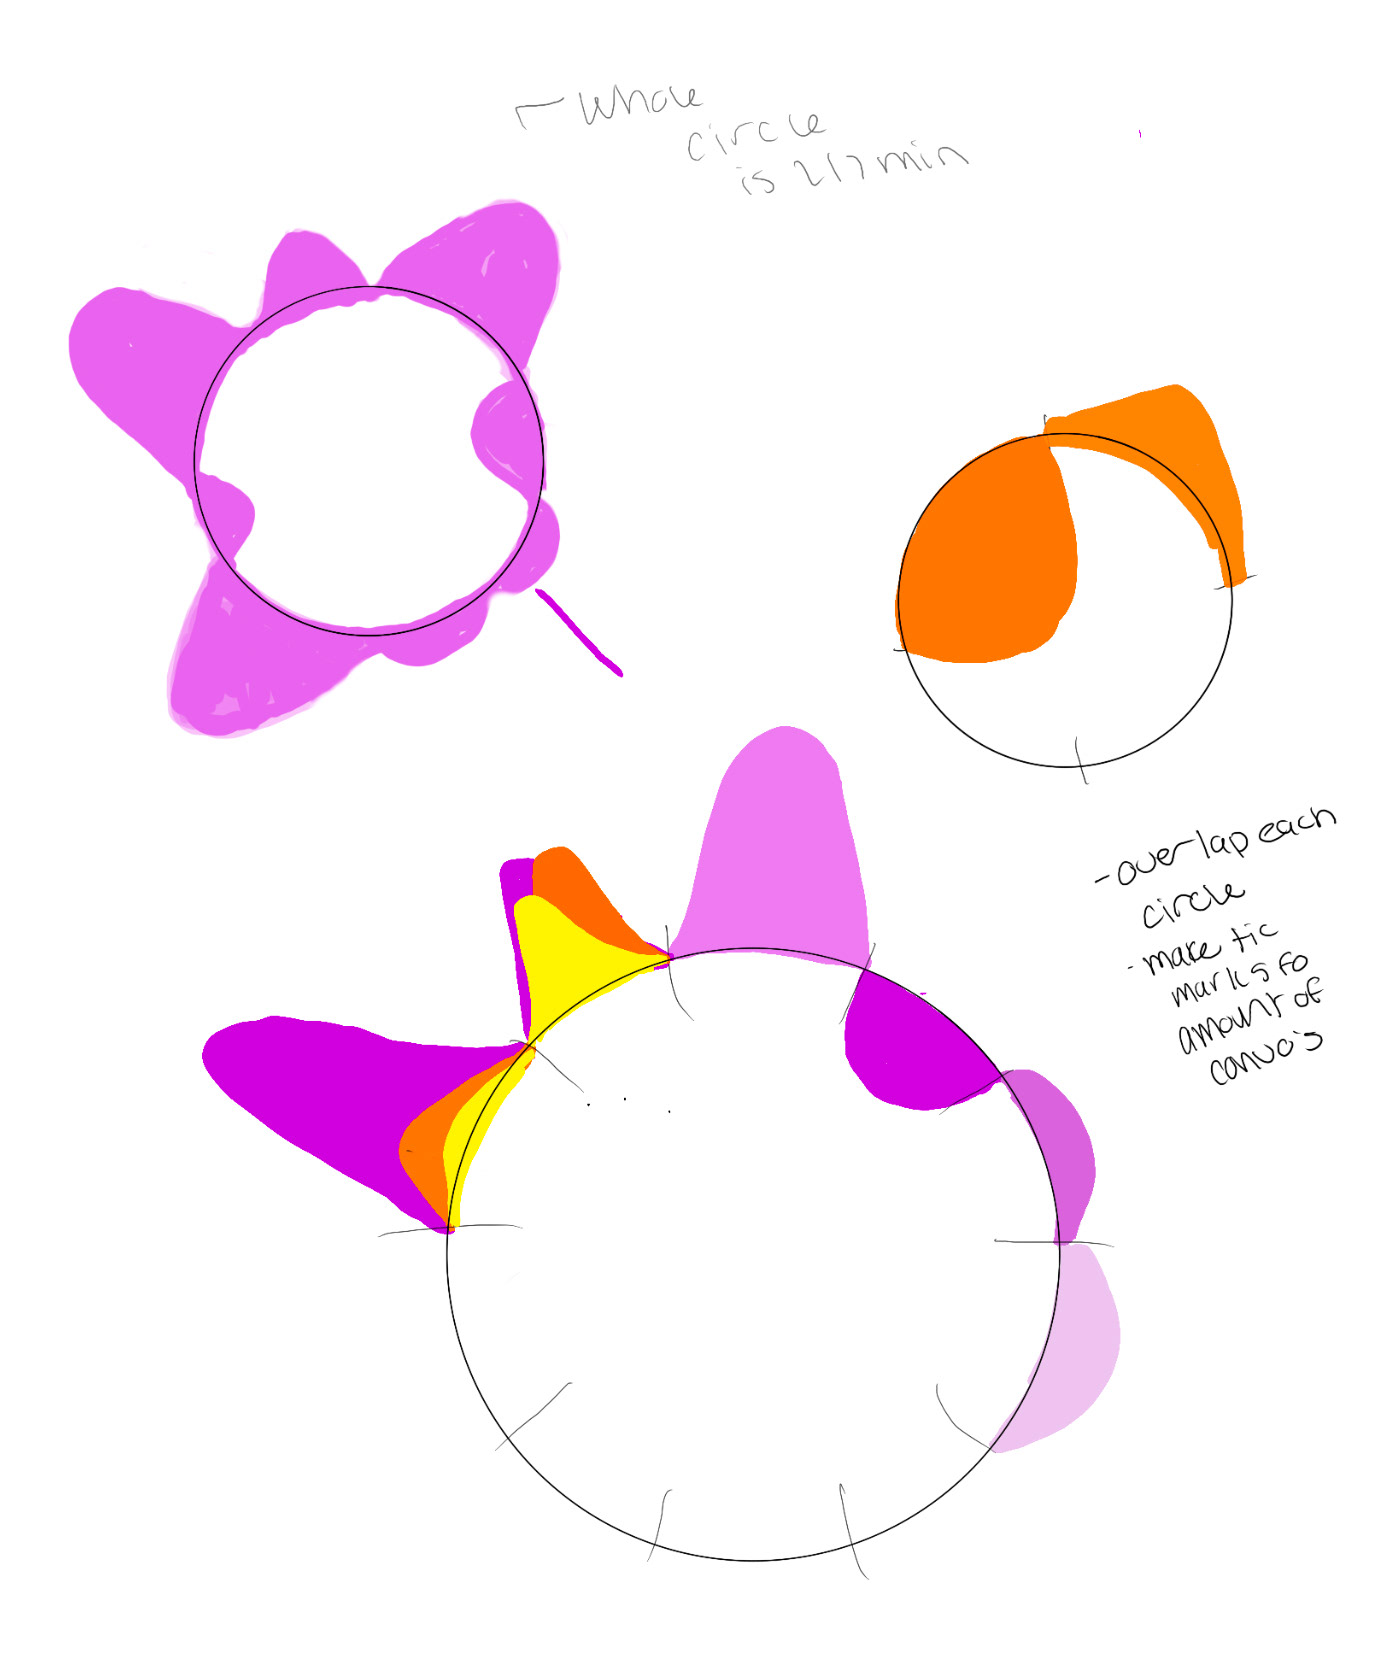
Sketches for potential ways to showcase my data, as I figured out calling people were points of gratitude and self-care.
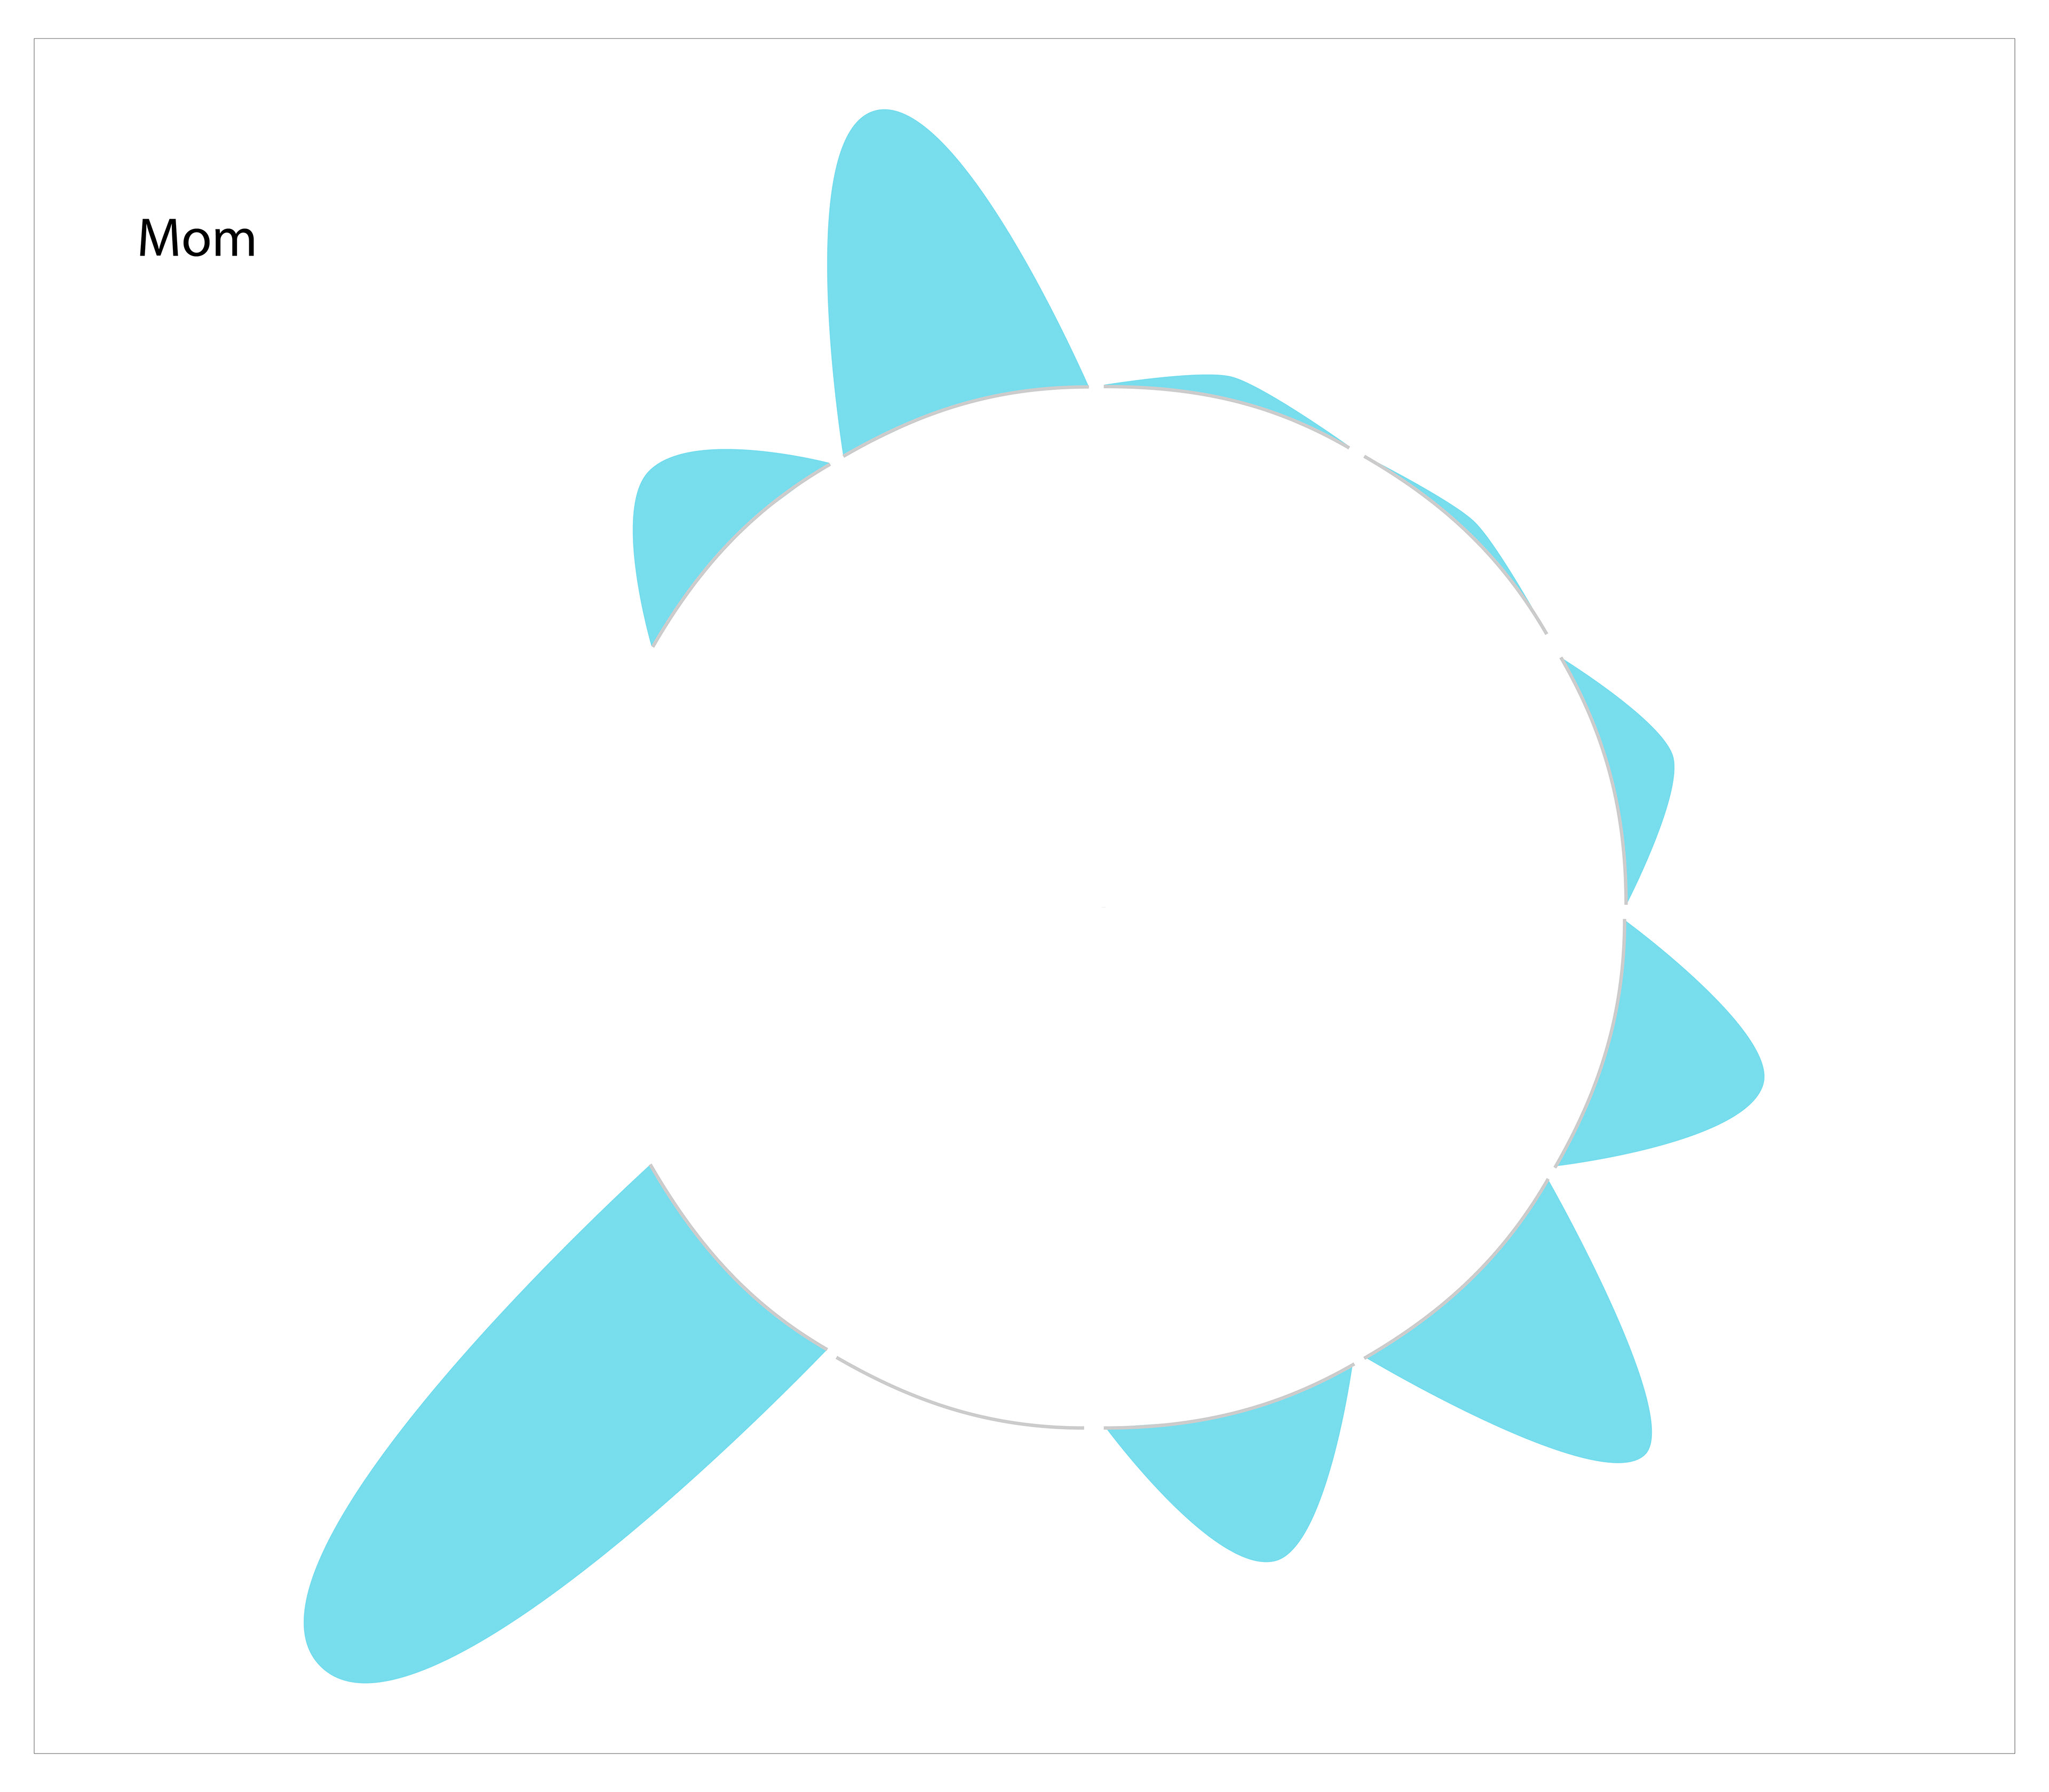
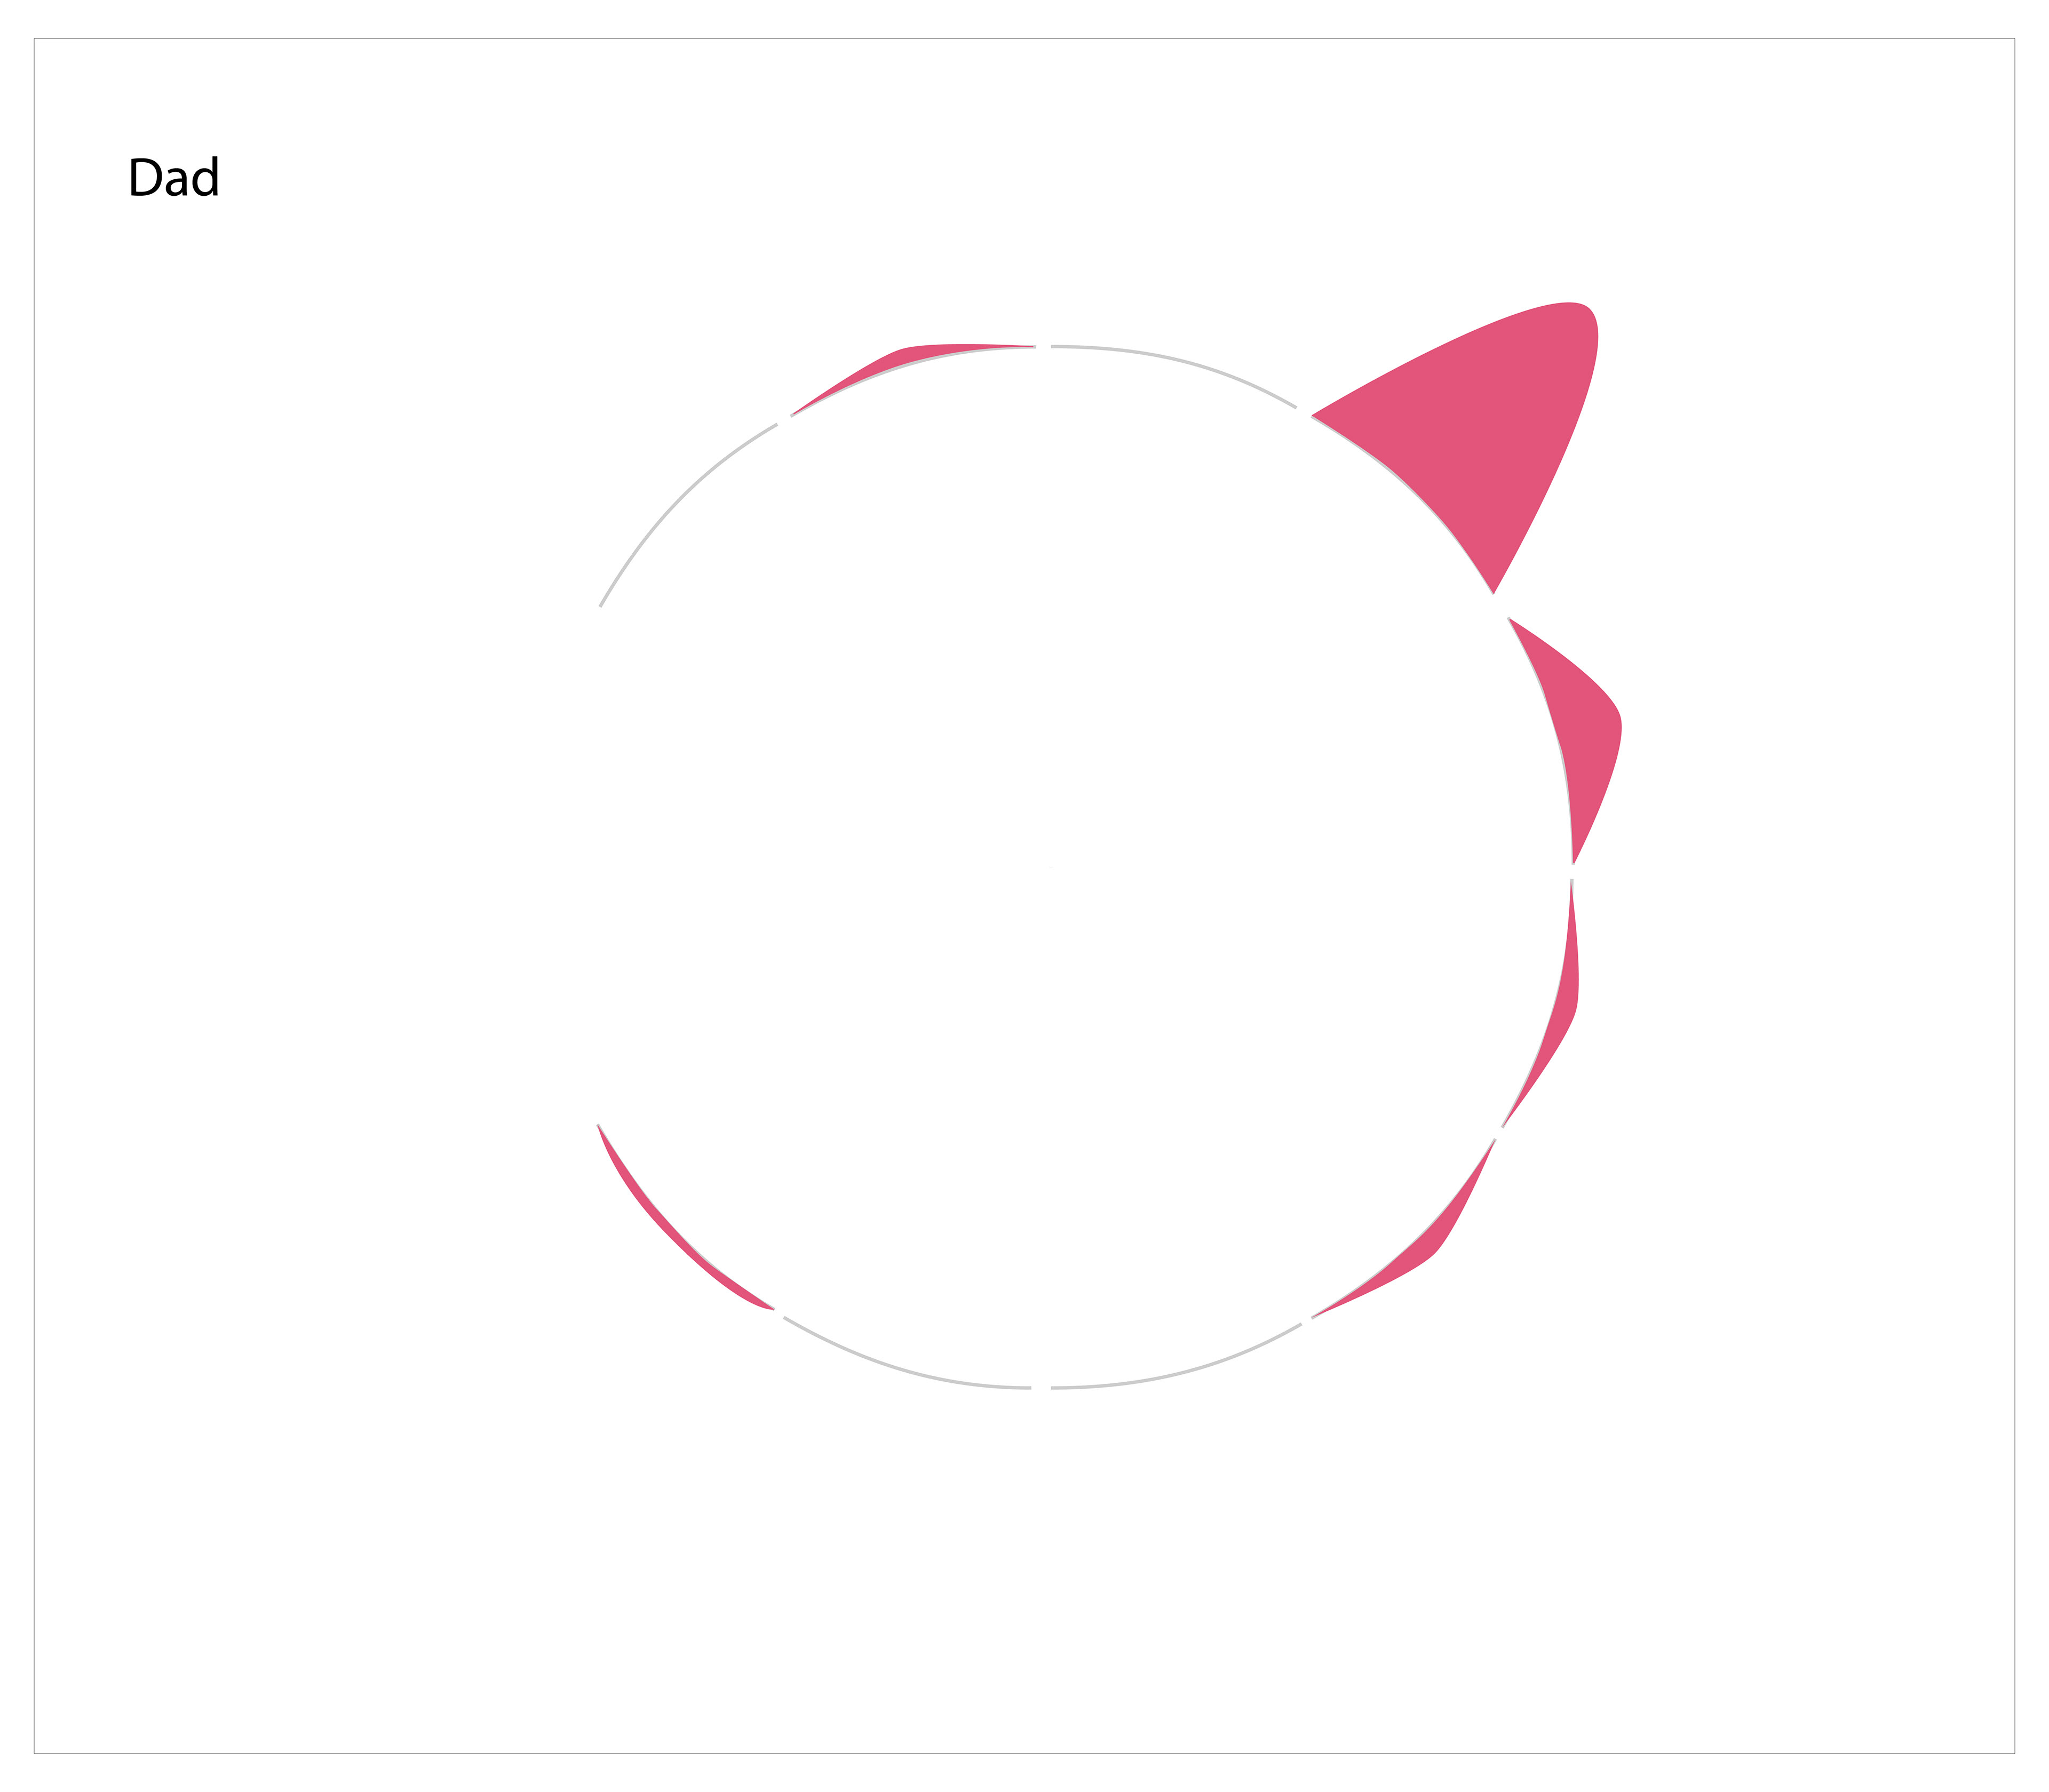
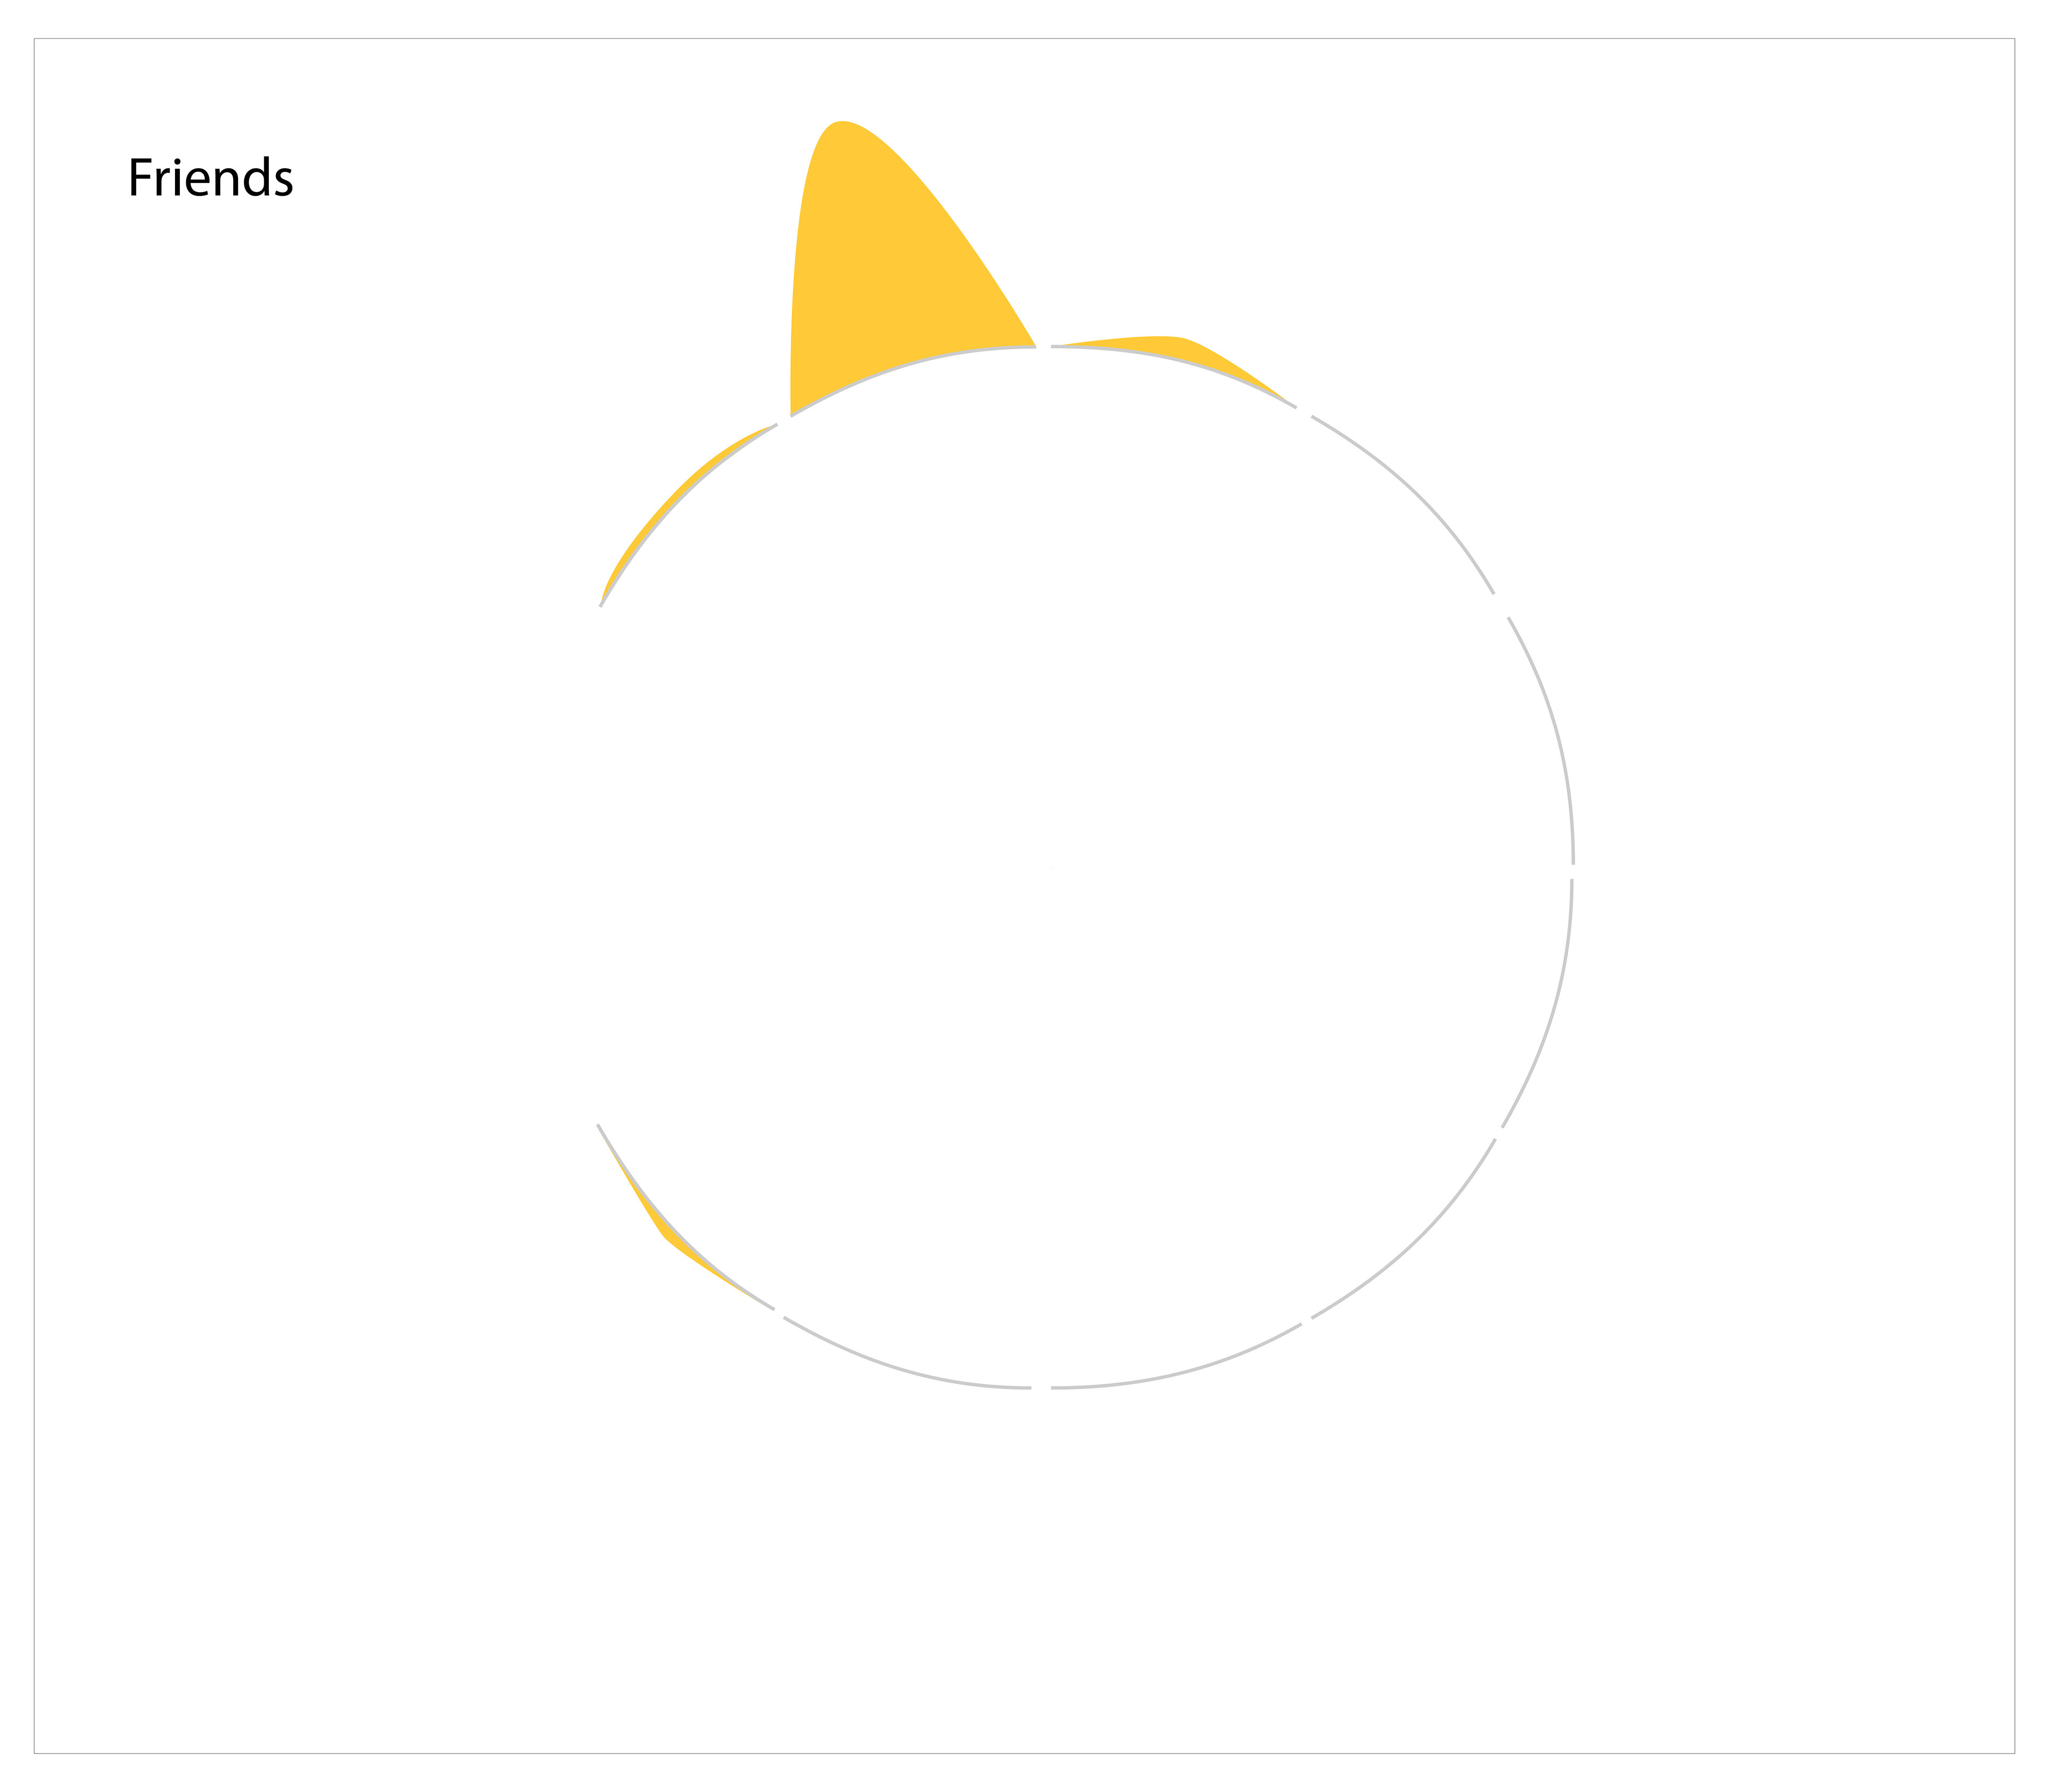
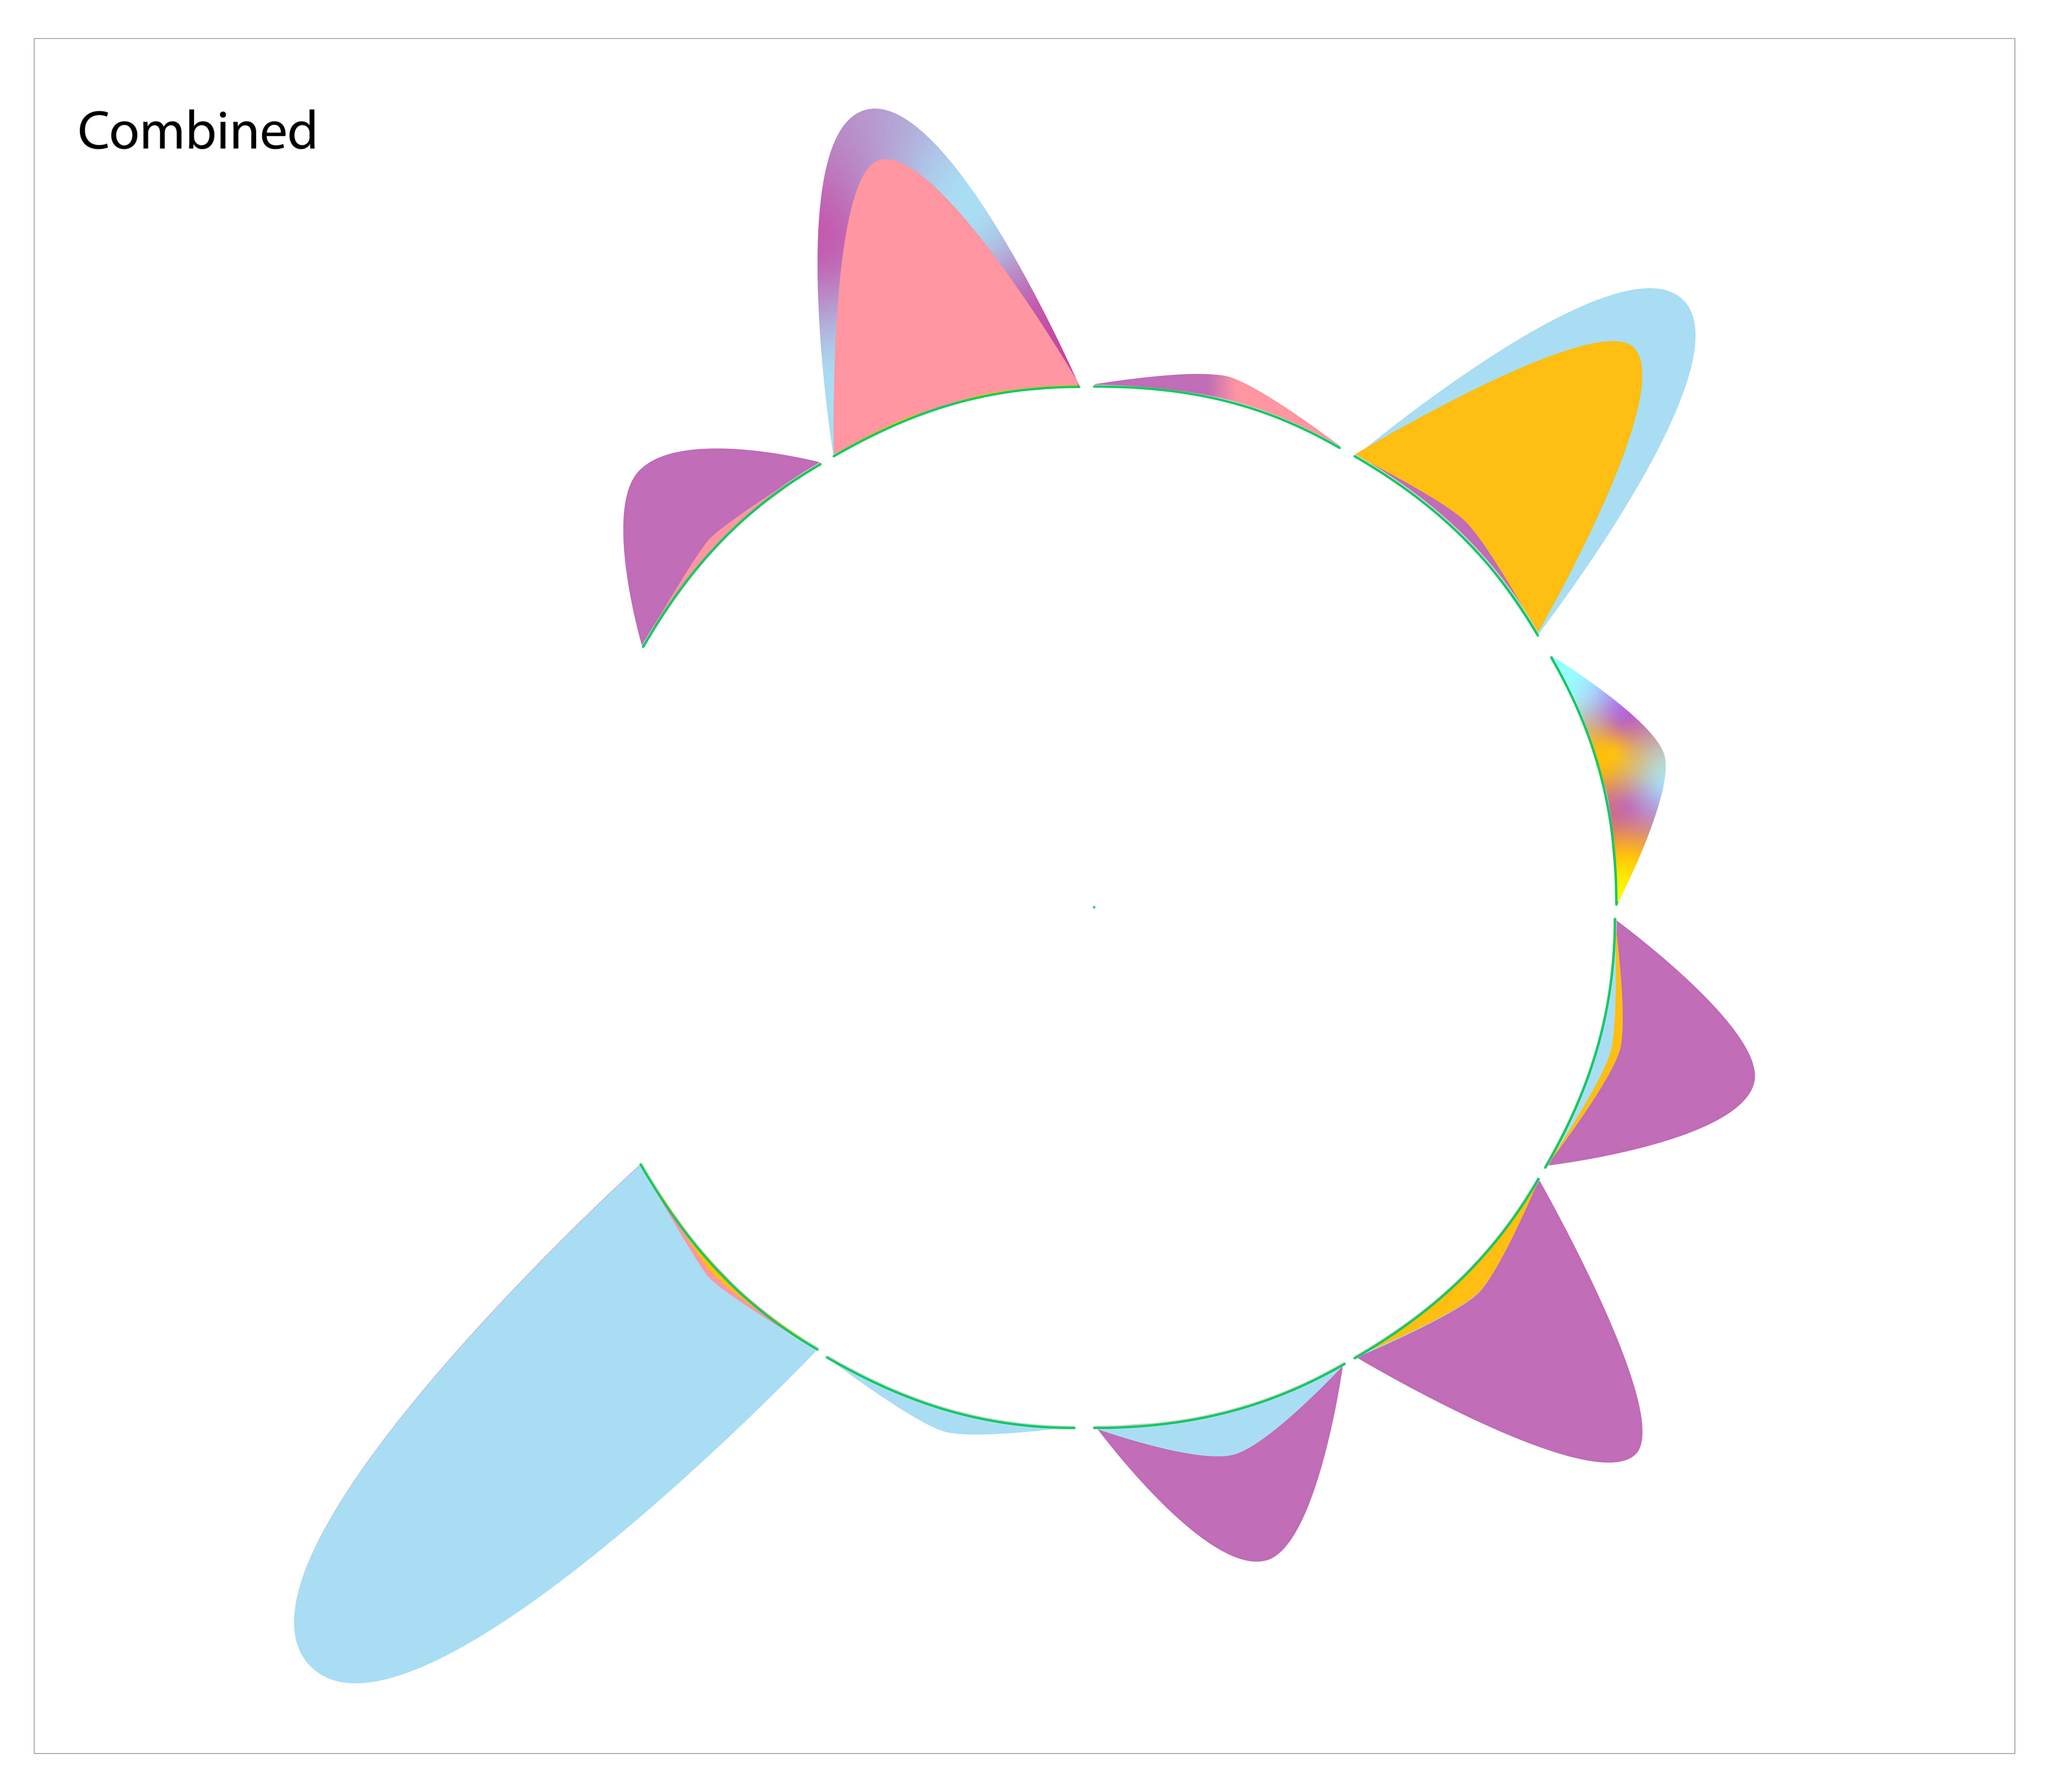
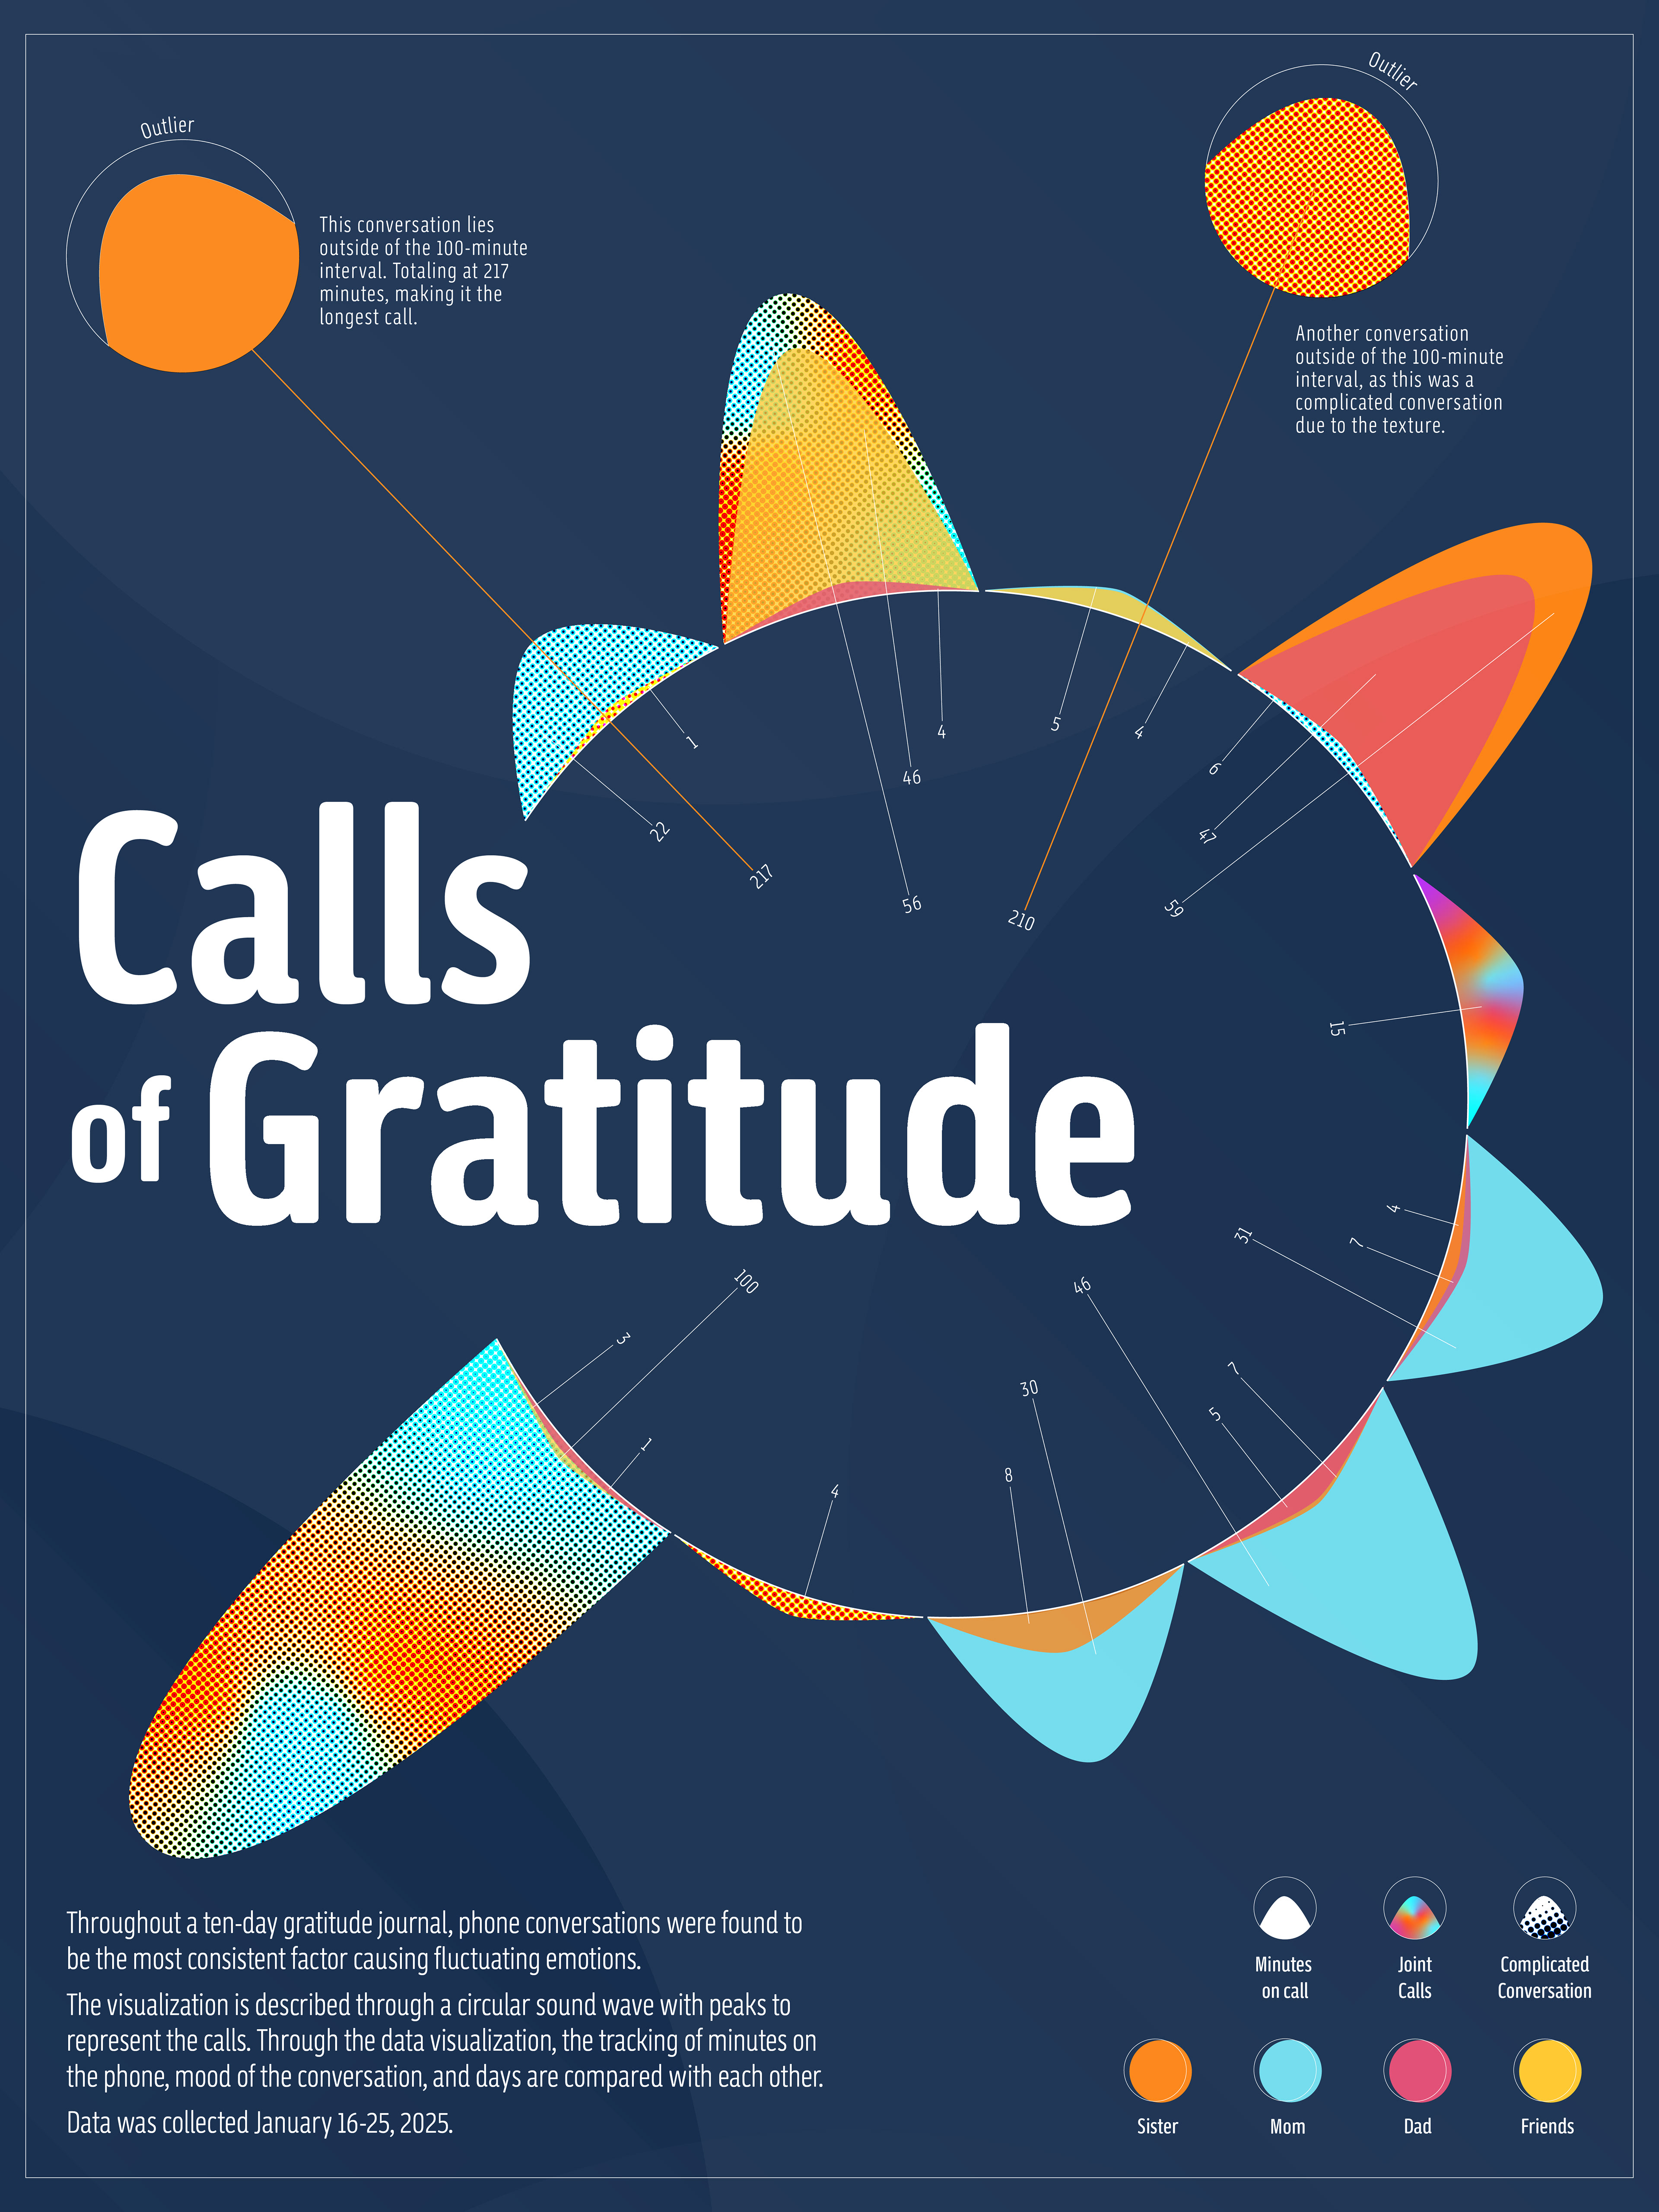
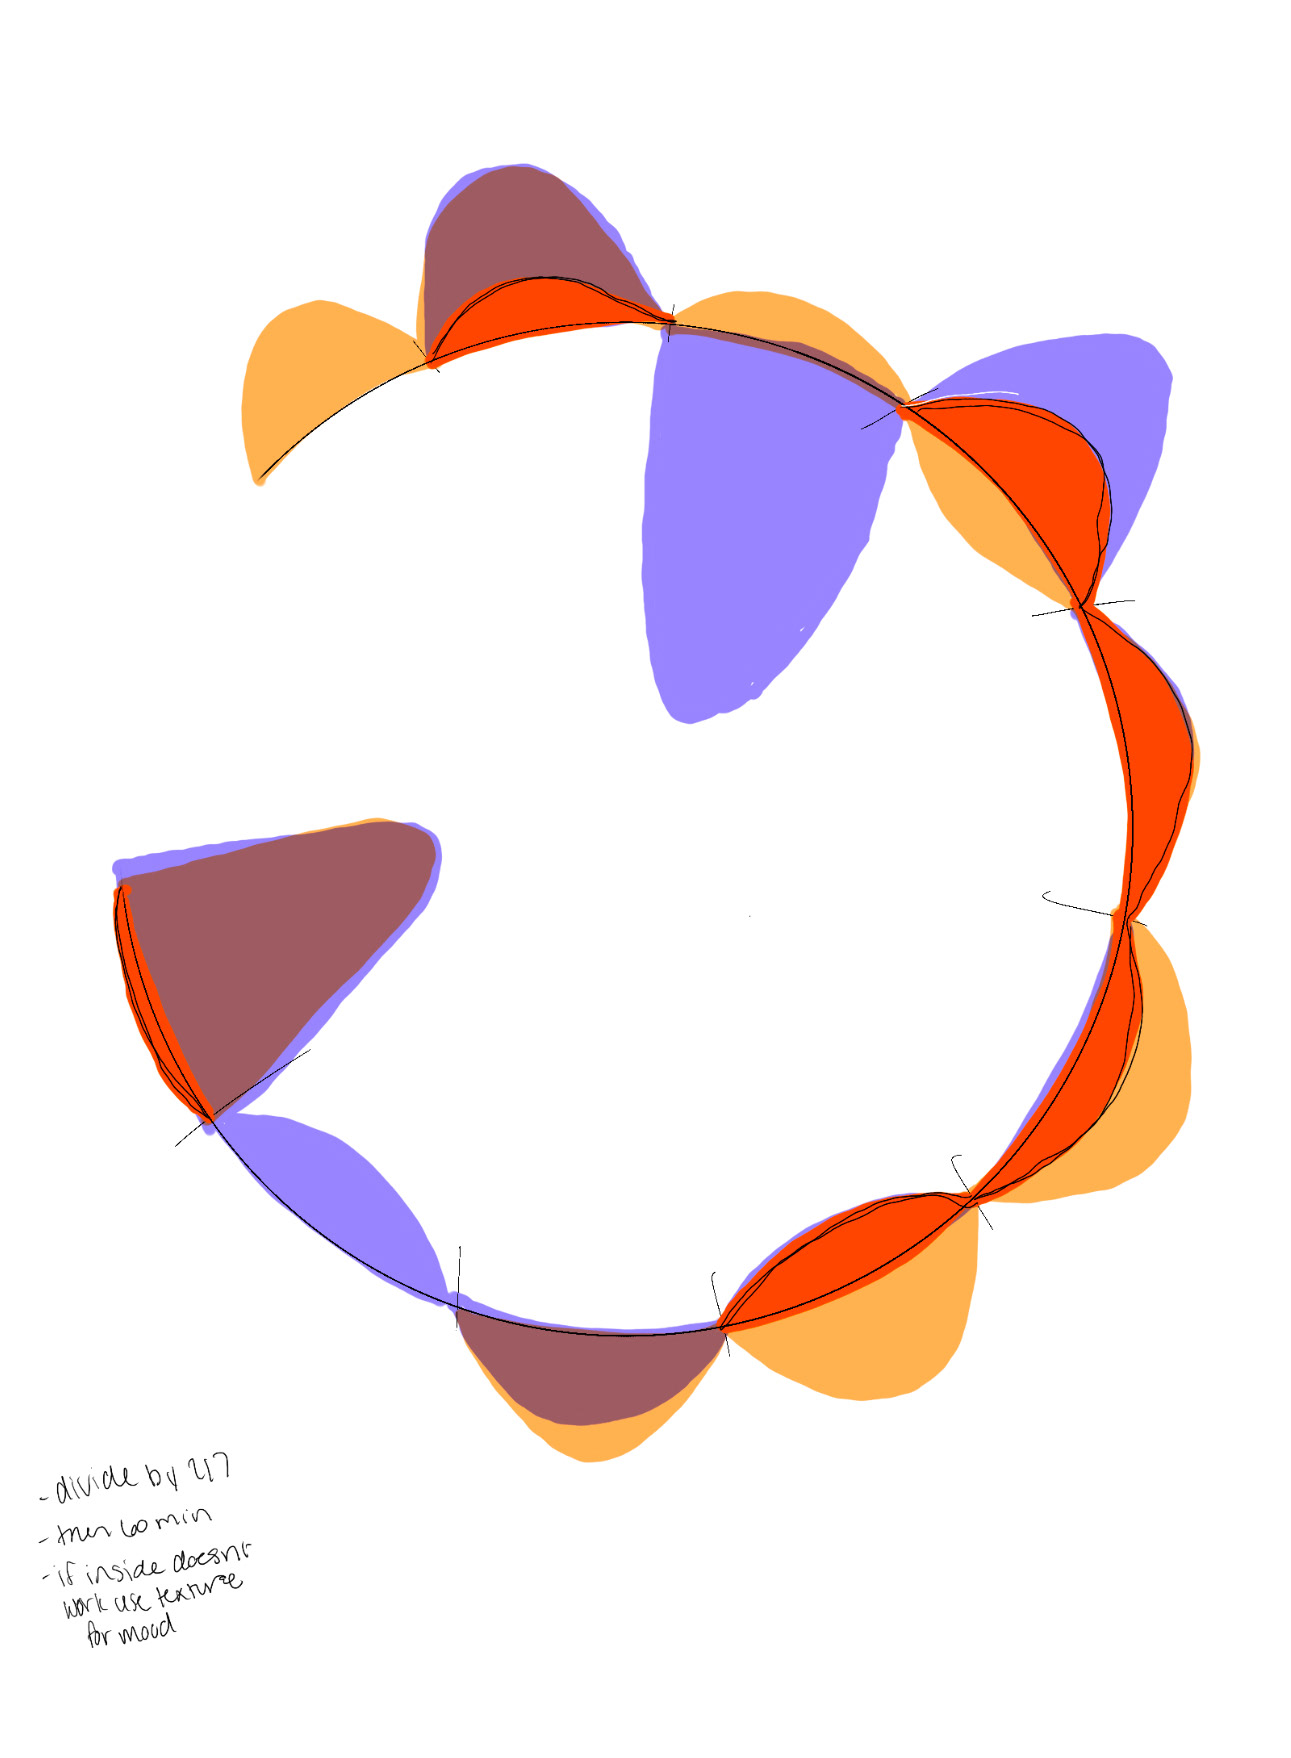
Individual data in the circular form for each point person, then the combination.
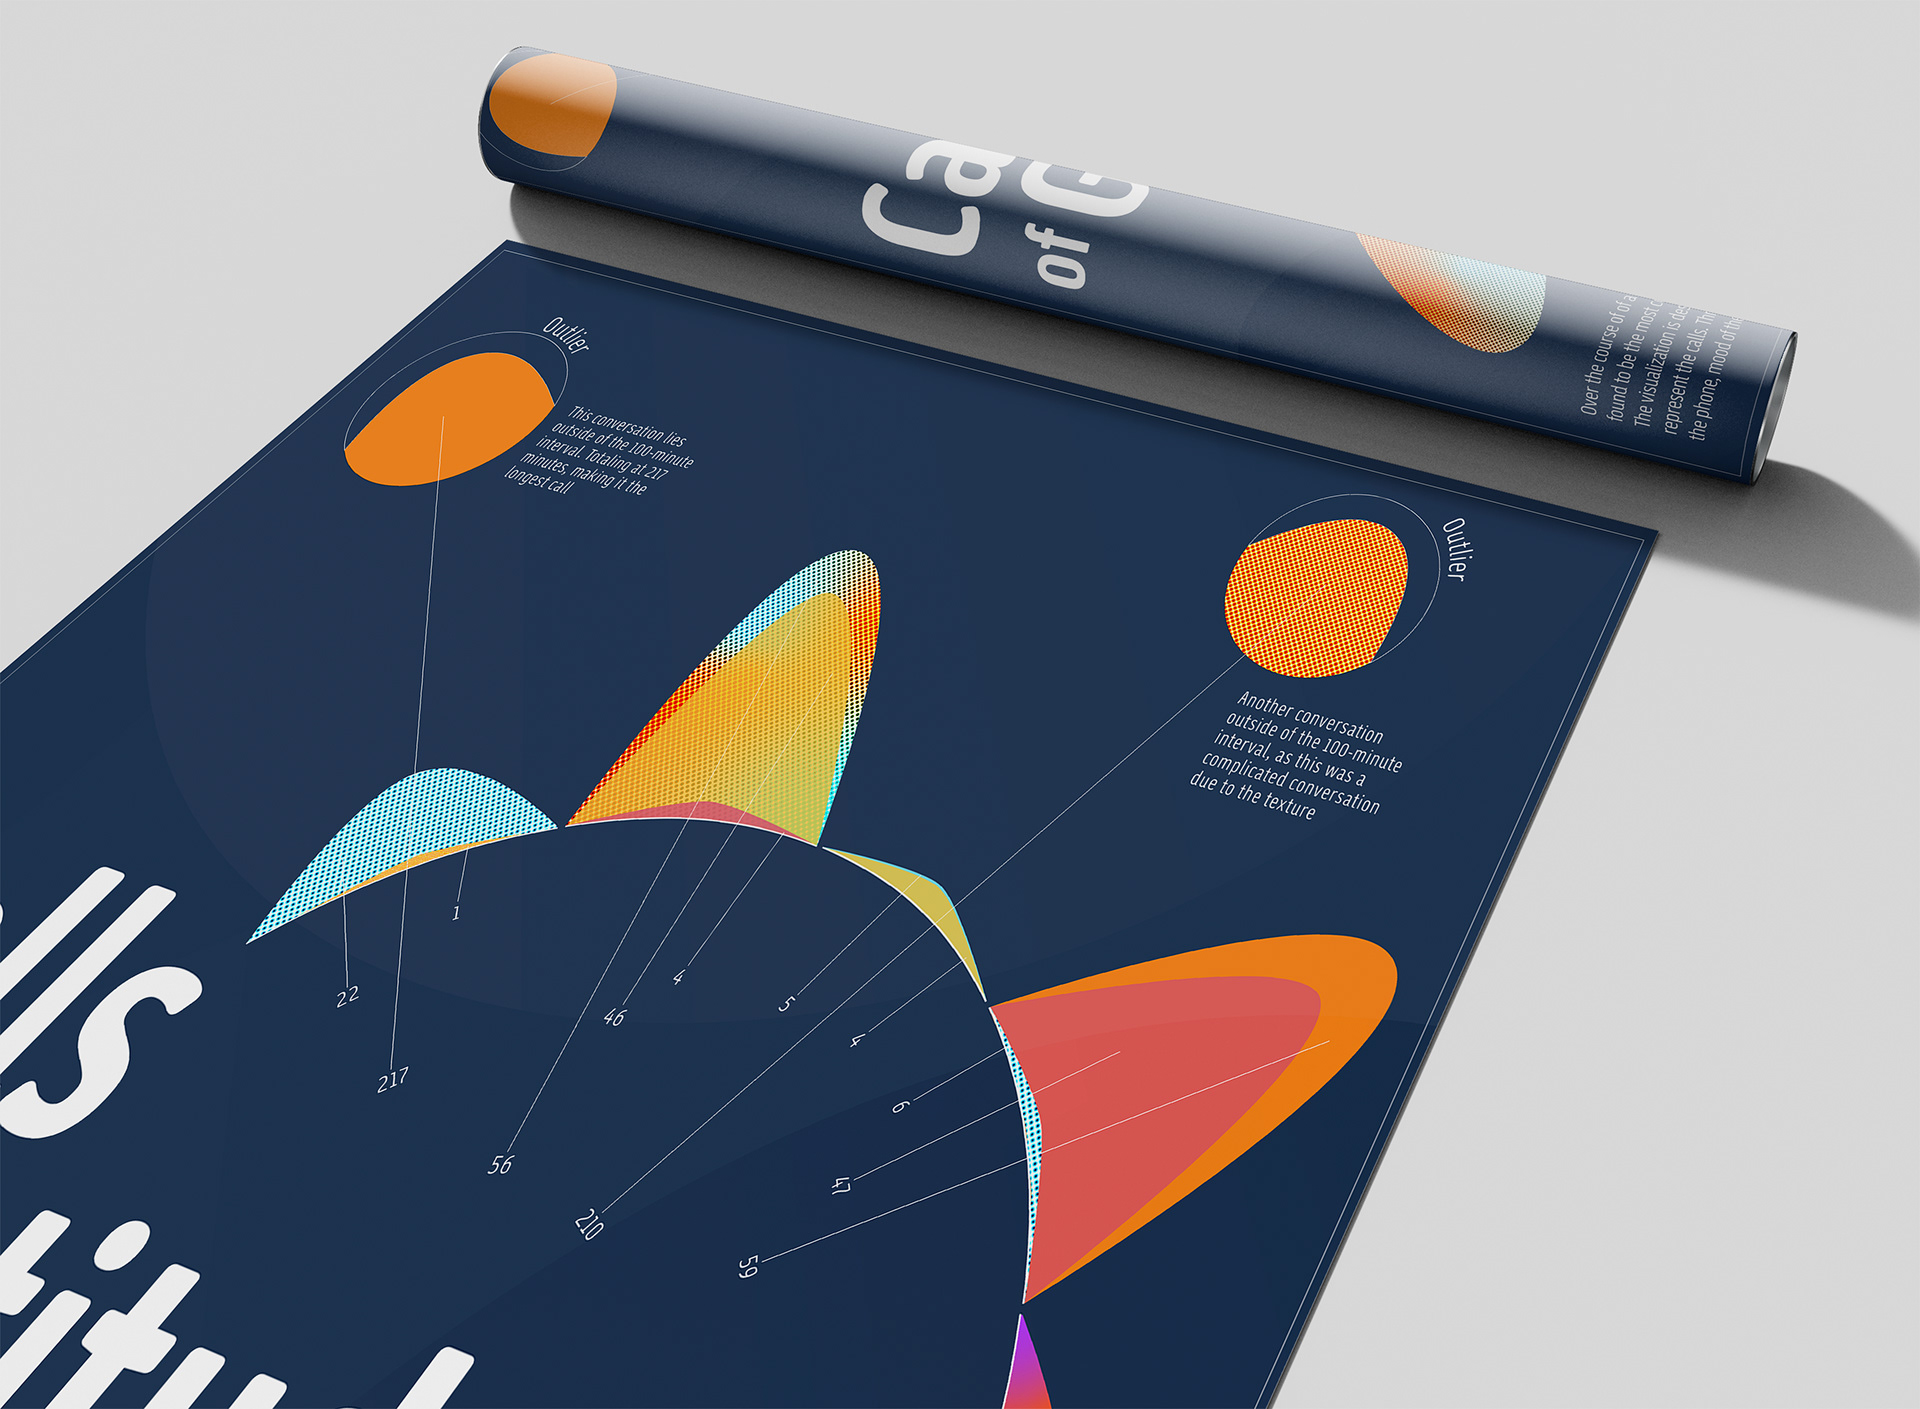
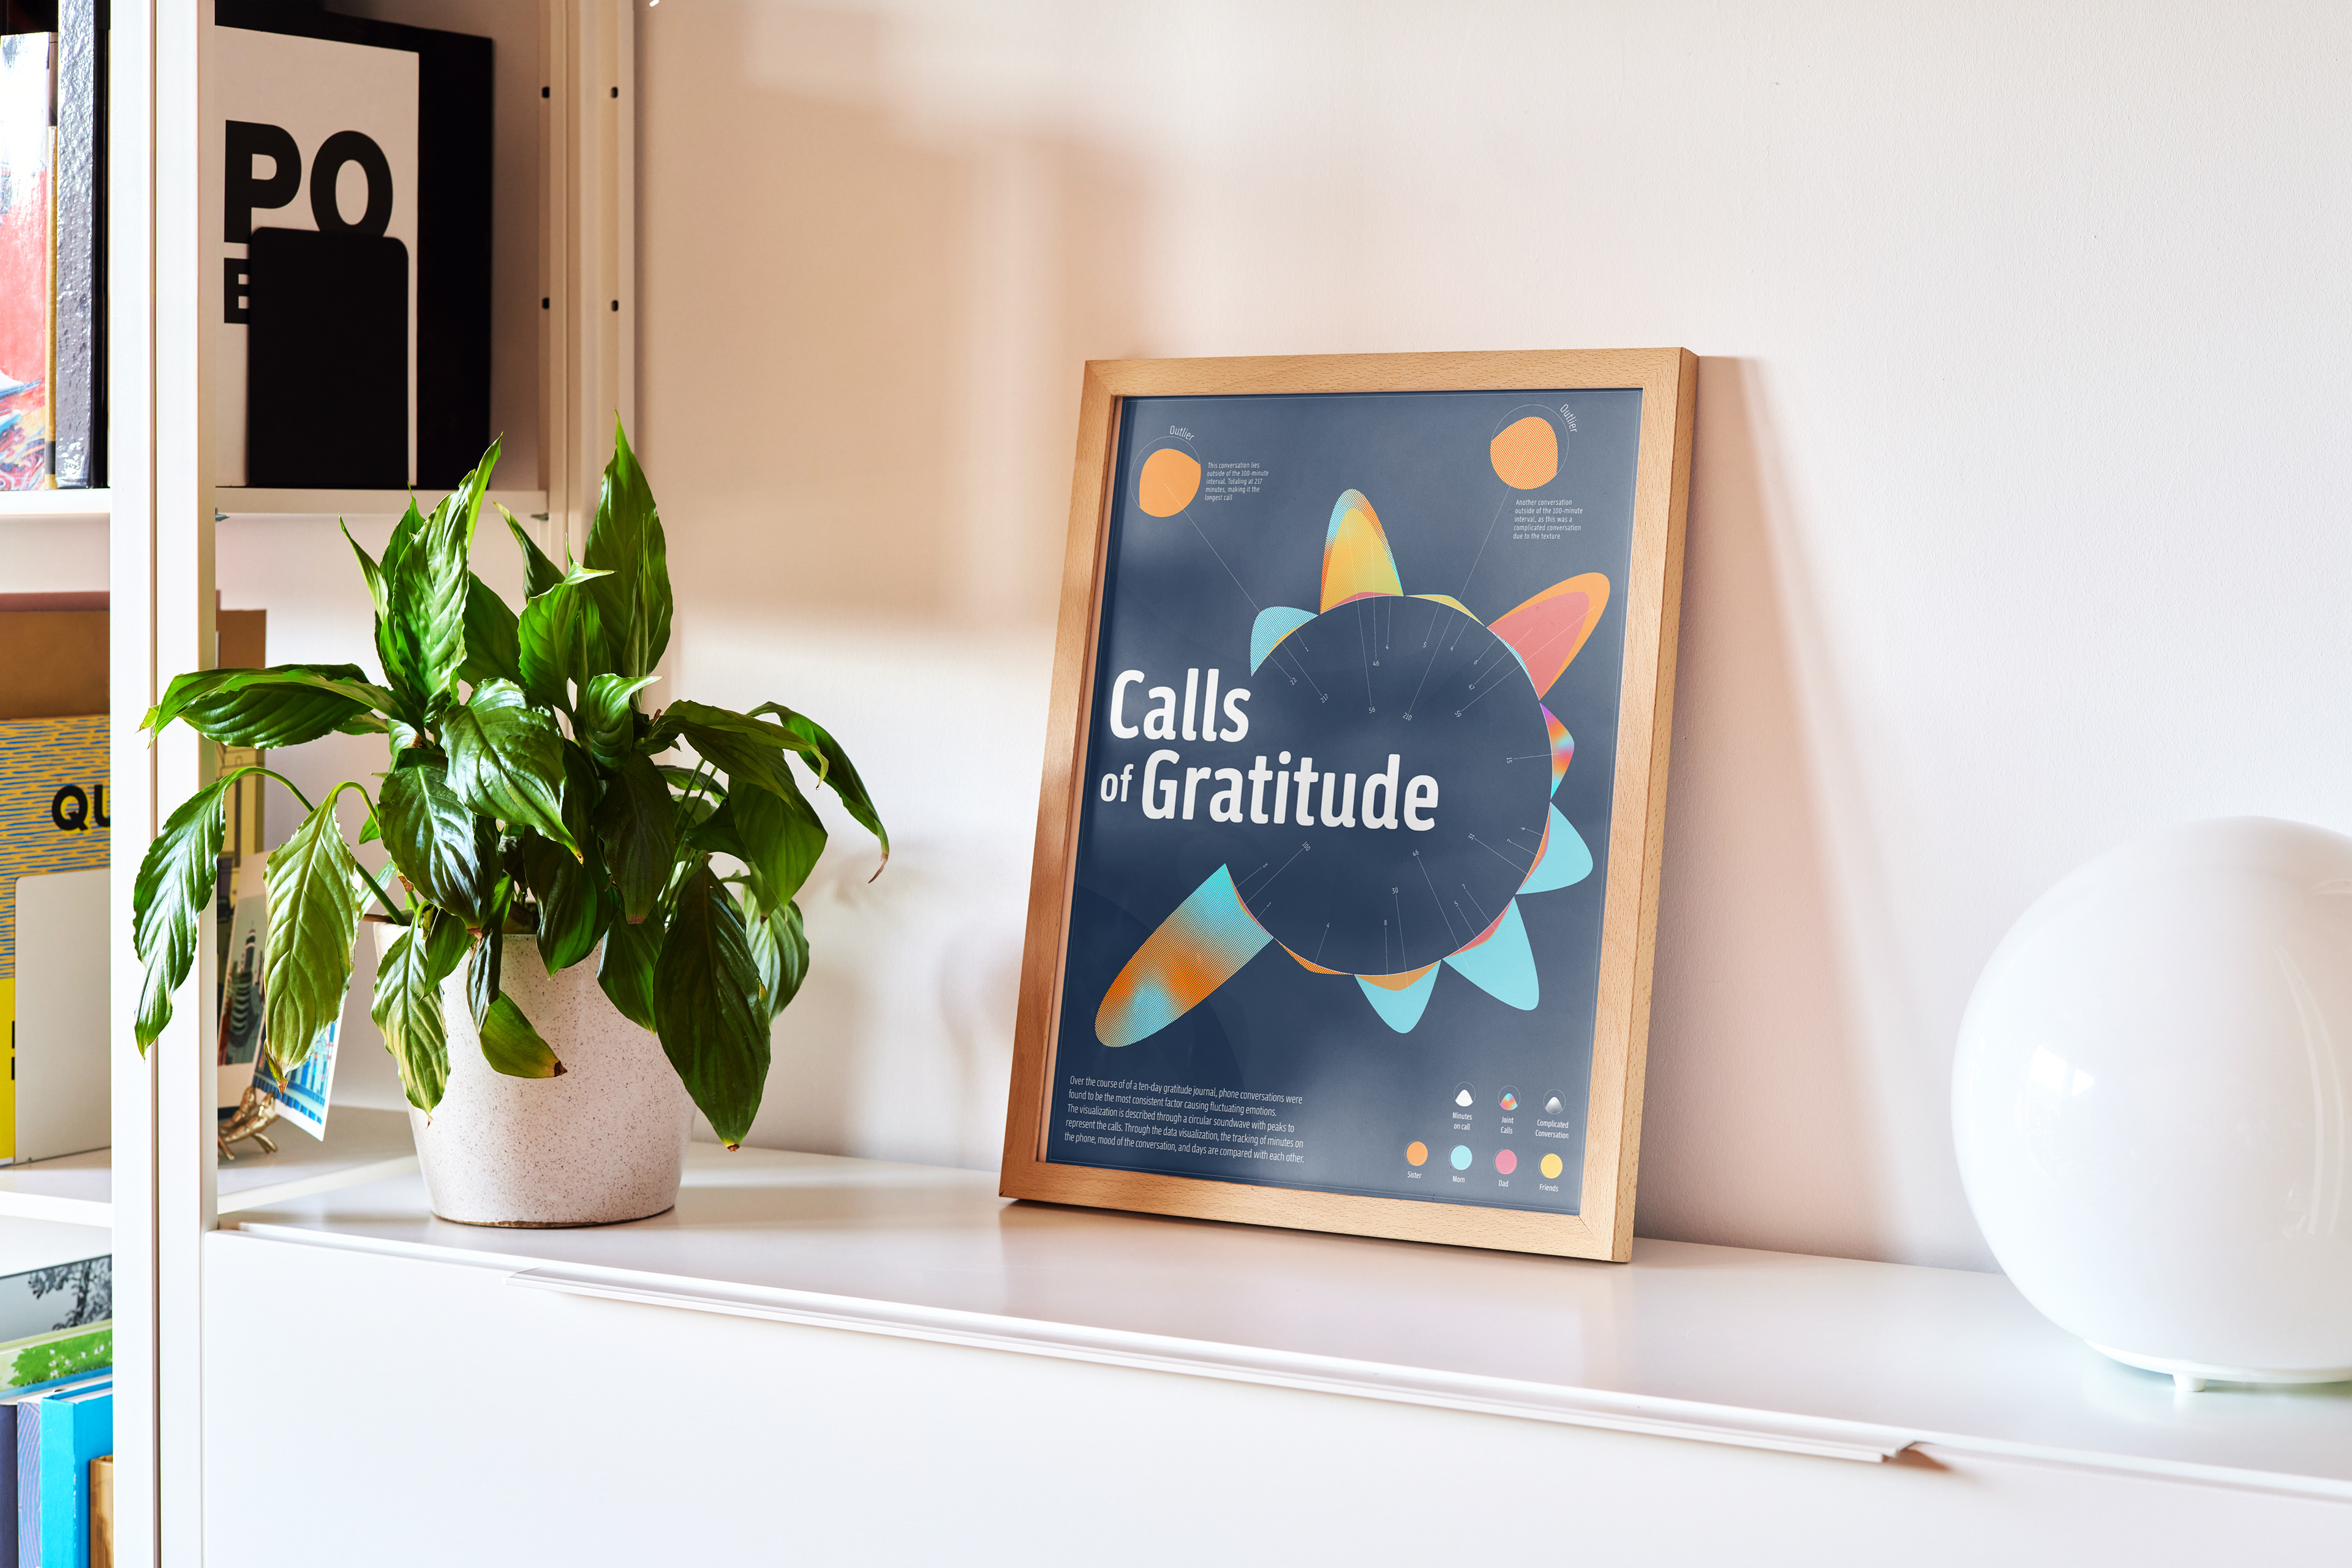
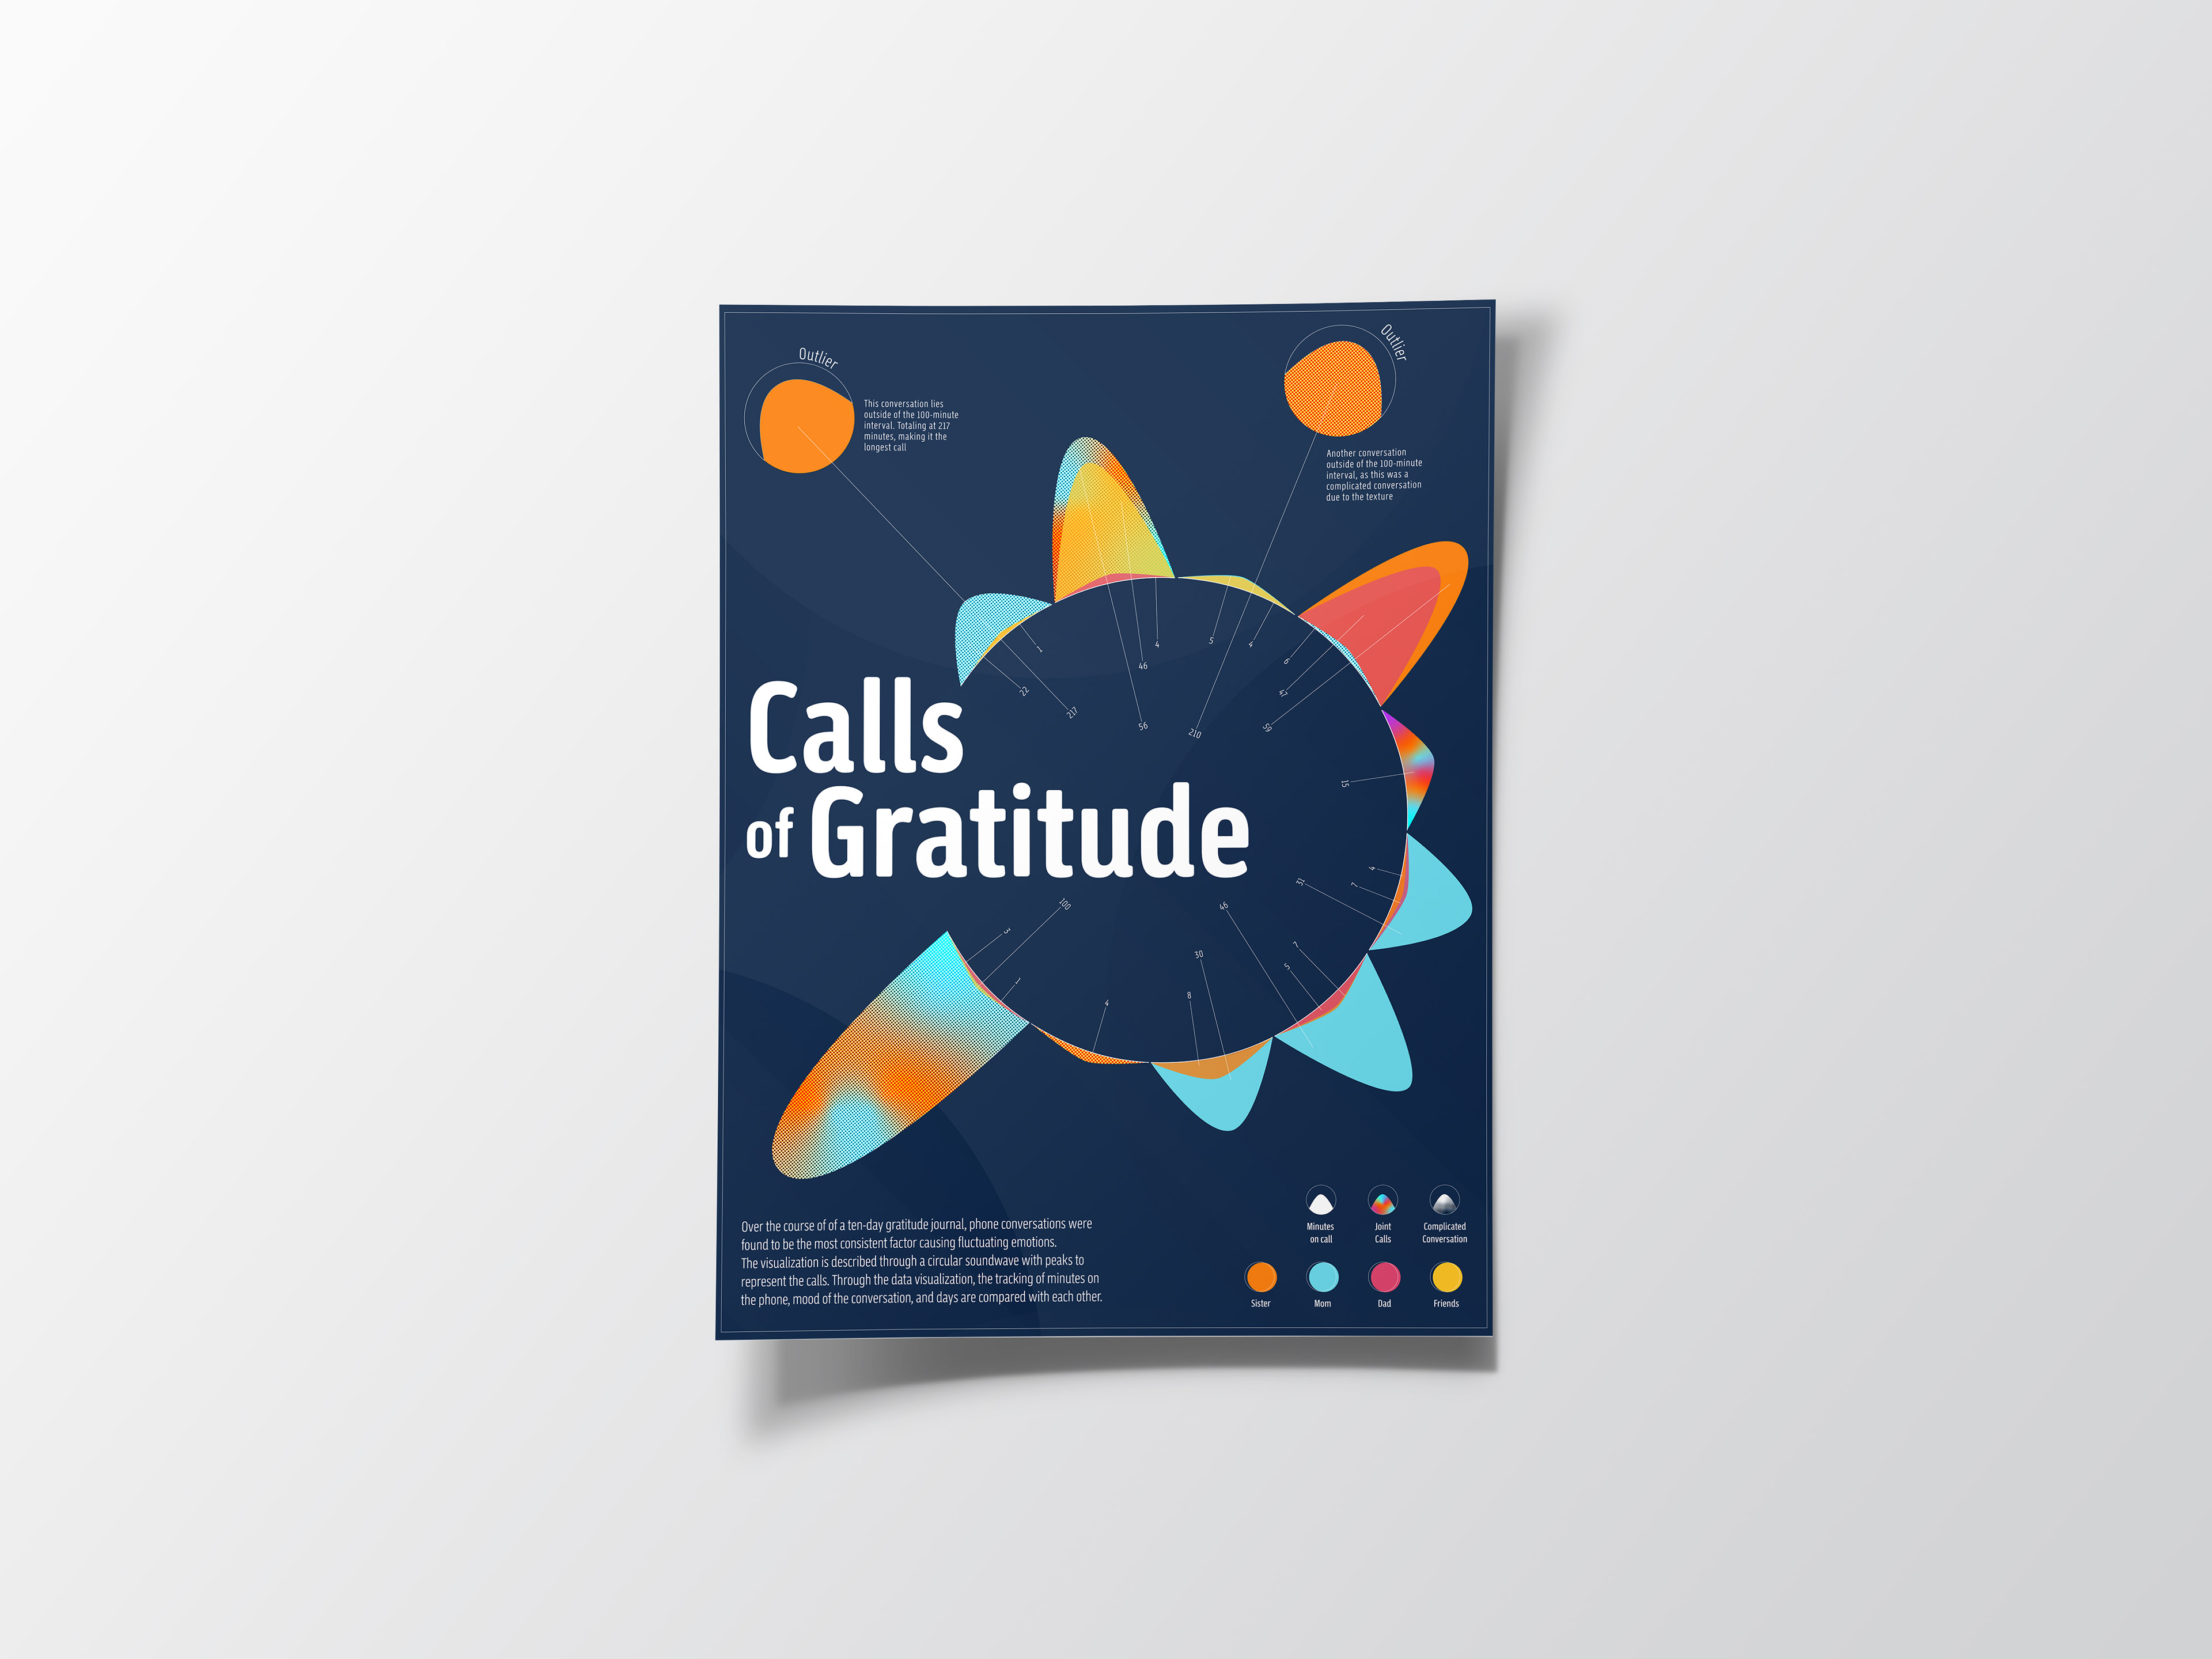
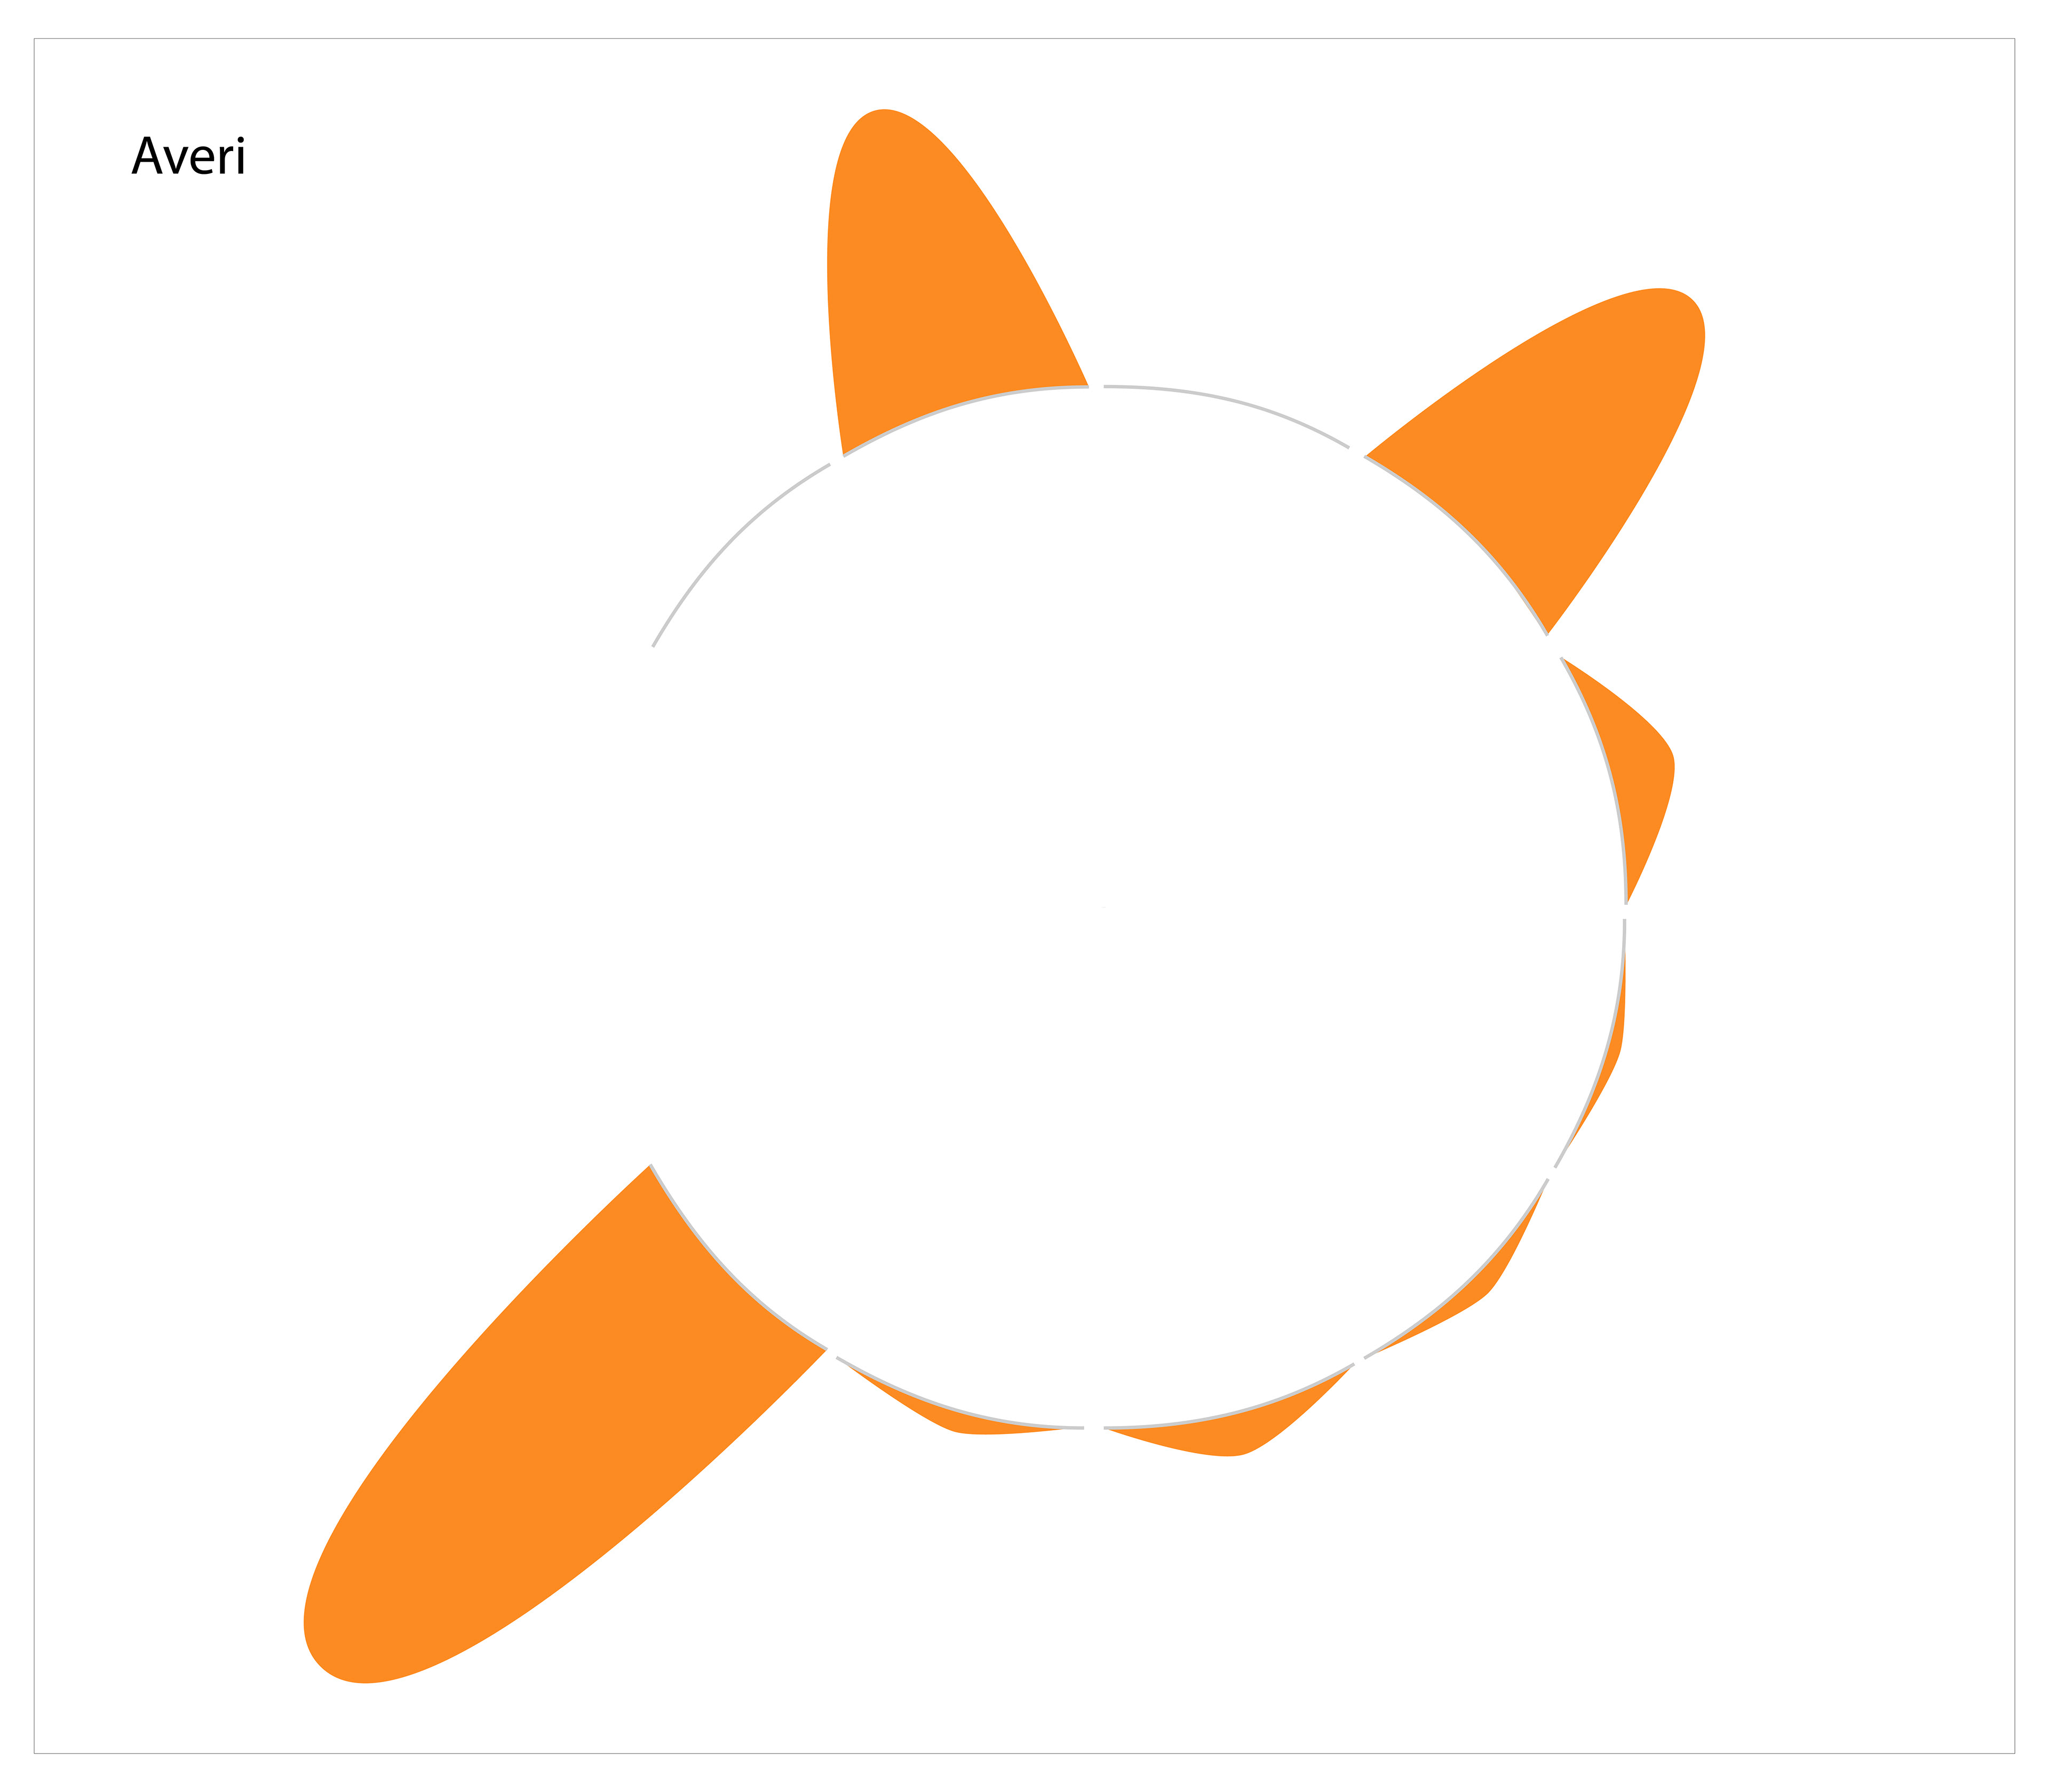
Mockups of the final poster.